Submit an Article
Navigate
Home
Editorial Board
Editorial Policies
Current Volume
Archive
Scientific Integrity
Publication Ethics Statements
Interviews with Outstanding Authors
Newsroom
Sponsored Conferences
Podcast
Contact
Special Collections
Submit an Article
Online ISSN: 1945-4589
Research Paper
|
Volume 13, Issue 1
|
pp. 794–812
Systematic construction and validation of an epithelial–mesenchymal transition risk model to predict prognosis of lung adenocarcinoma
Back to article
Figure 3
(3 of 10)
−
100%
+
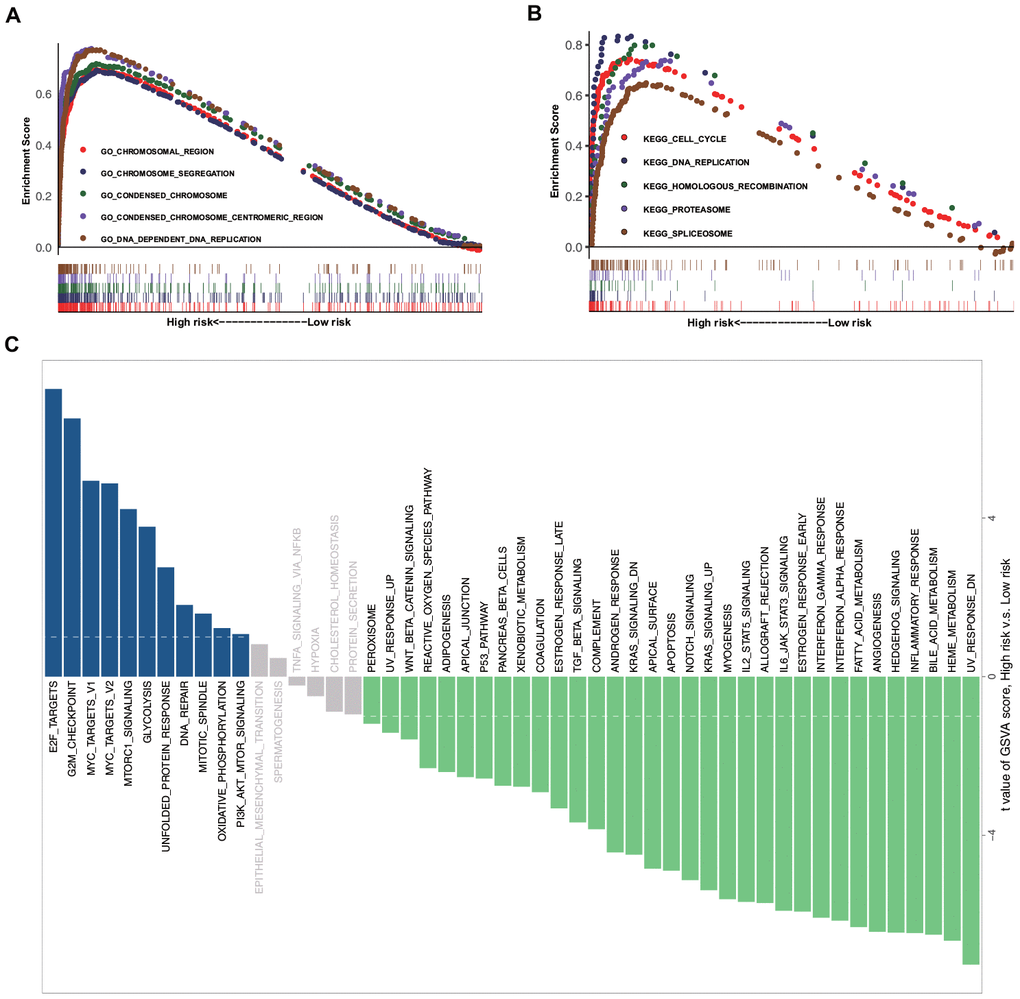
Figure 3.
GSEA and GSVA data.
(
A
) Top five representative GO annotation terms in the high-risk group. (
B
) Top five representative KEGG pathways in the high-risk group. (
C
) Comparison of the low- and high-risk groups using GSVA.