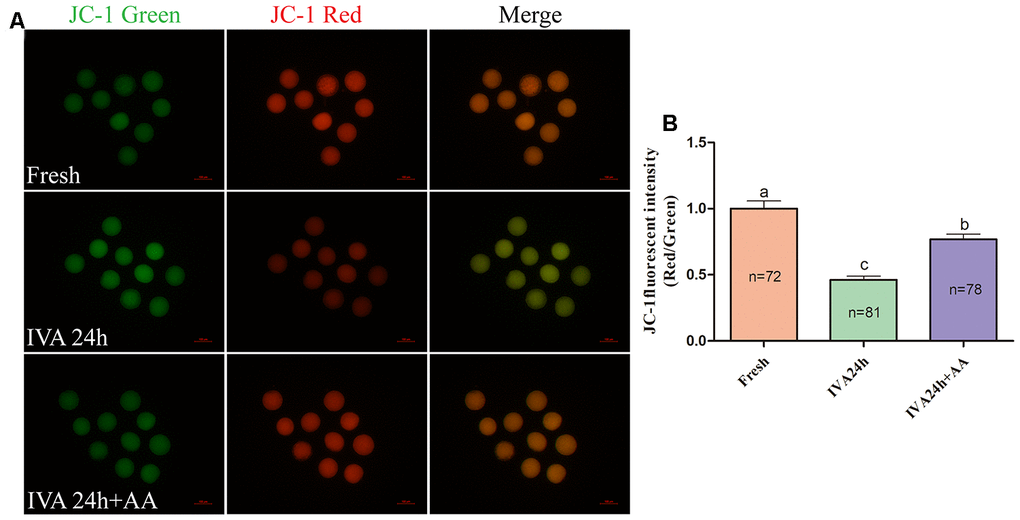
Figure 9.Effects of AA supplementation on the mitochondrial function of in vitro aged porcine oocytes. (A) Representative fluorescent images of JC-1 stained oocytes from each group. Scale bar=100 μm. (B) Relative JC-1 fluorescence intensity (red/green) in oocytes from each group. The number of oocytes examined in each group is shown by the bars. Statistically significant differences are indicated by different letters (p<0.05).