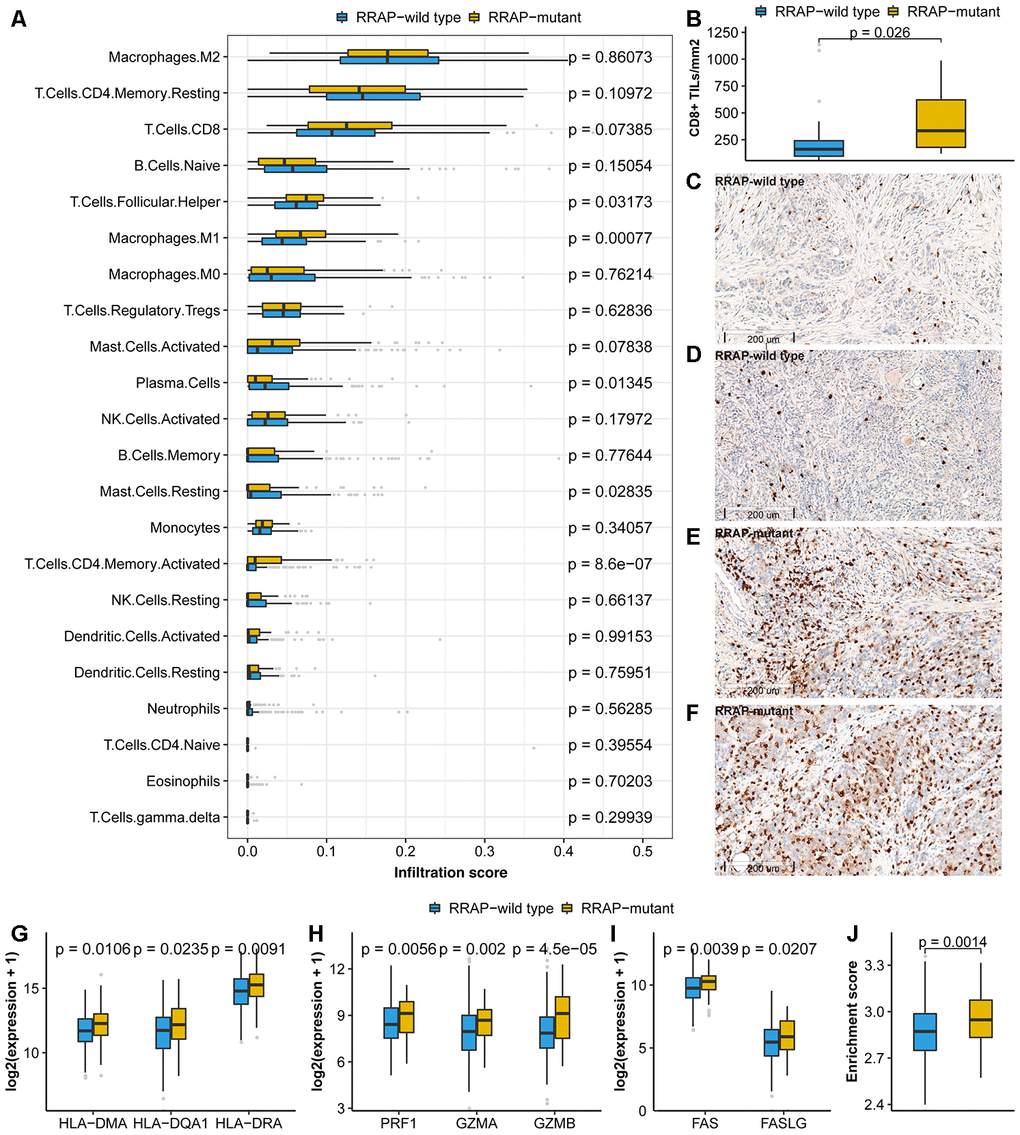
Figure 5.Association of RRAP with the tumor microenvironment. (A) Immune infiltrations estimated by CIBERSORT were compared between RRAP-wild type tumors and RRAP-mutant tumors. (B) The density of CD8+ TILs was compared between RRAP-wild type and RRAP-mutant tumors. (C–F) The representative immunohistochemistry for CD8 images of RRAP-wild type tumor tissue (C, D) and RRAP-mutant tumor tissue (E, F). (G–I) Expression values were compared for HLA class II genes (G), cytotoxic effector molecules (H), and apoptosis-related genes (I). (J) The boxplot shows the difference in enrichment score of the apoptosis pathway between RRAP-wild type and RRAP-mutant tumors. The Wilcoxon rank-sum test was applied to estimate the p-values.