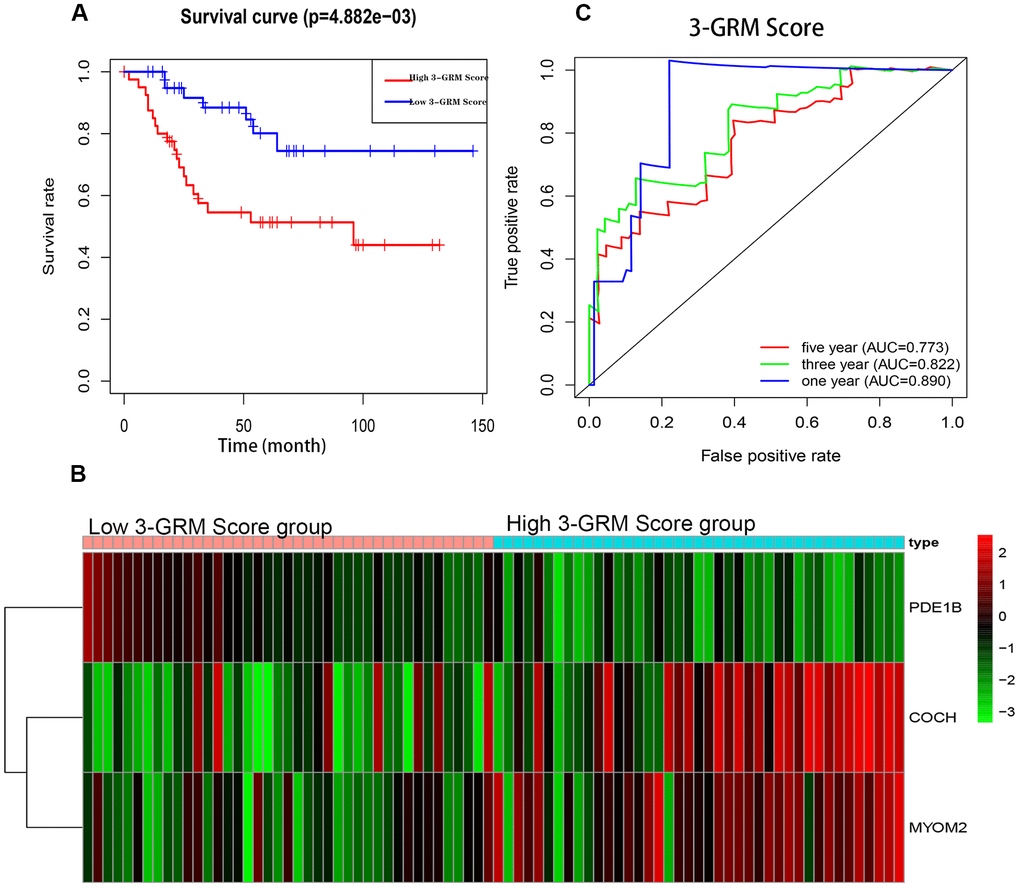
Figure 5.Prognostic analysis of the 3-genes risk model (3-GRM) in TARGET. (A) Prognostic analysis between the high and low 3-GRM score group. (B) Differences of COCH, MYOM2 and PDE1B expression levels between the high and low 3-GRM score group. (C) Time-dependent ROC curve analysis of the 3-GRM.