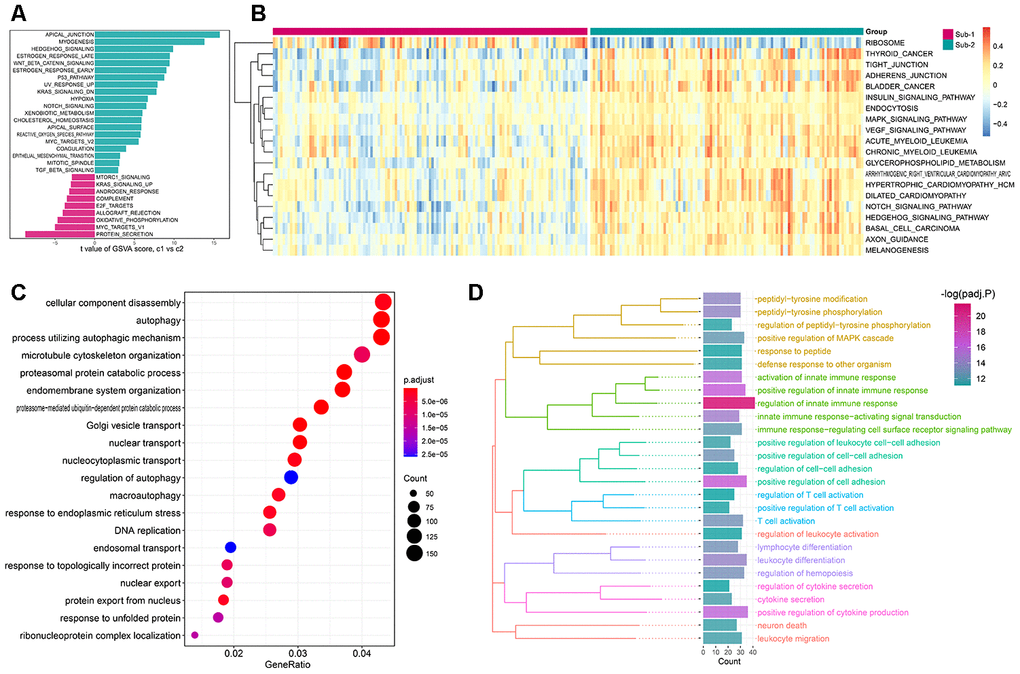
Figure 8.The underlying biological characteristics diversity among 2 autophagy-mediated regulation patterns. (A, B) The differences of the HALLMARKS pathway and KEGG pathway enrichment score between autophagy-mediated pattern 1 and pattern 2 (A for HALLMARKS pathway and B for KEGG pathway). (C) GO-BP functional enrichment analysis revealed the biological characteristics of autophagy phenotype-related genes. (D) The GO-BP enrichment analysis for the autophagy phenotype-related immune genes uncovers the relationship between autophagy and immune regulations. GO categories are grouped according to functions.