Submit an Article
Navigate
Home
Editorial Board
Editorial Policies
Current Volume
Archive
Scientific Integrity
Publication Ethics Statements
Interviews with Outstanding Authors
Newsroom
Sponsored Conferences
Podcast
Contact
Special Collections
Submit an Article
Online ISSN: 1945-4589
Research Paper
|
Volume 13, Issue 1
|
pp. 450–459
Comparative efficacy, safety, and acceptability of single-agent poly (ADP-ribose) polymerase (PARP) inhibitors in
BRCA
-mutated
HER2
-negative metastatic or advanced breast cancer: a network meta-analysis
Back to article
Figure 3
(3 of 8)
−
100%
+
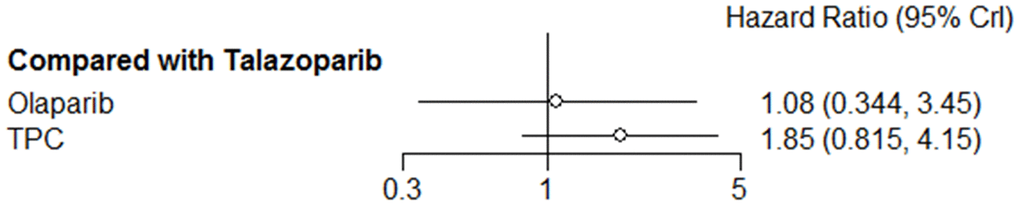
Figure 3.
Forest plot comparing PFS for talazoparib, olaparib, and TPC.