Submit an Article
Navigate
Home
Editorial Board
Editorial Policies
Current Volume
Archive
Scientific Integrity
Publication Ethics Statements
Interviews with Outstanding Authors
Newsroom
Sponsored Conferences
Podcast
Contact
Special Collections
Submit an Article
Online ISSN: 1945-4589
Research Paper
|
Volume 12, Issue 24
|
pp. 25828–25844
A glycolysis-related gene signature predicts prognosis of patients with esophageal adenocarcinoma
Back to article
Figure 8
(8 of 9)
−
100%
+
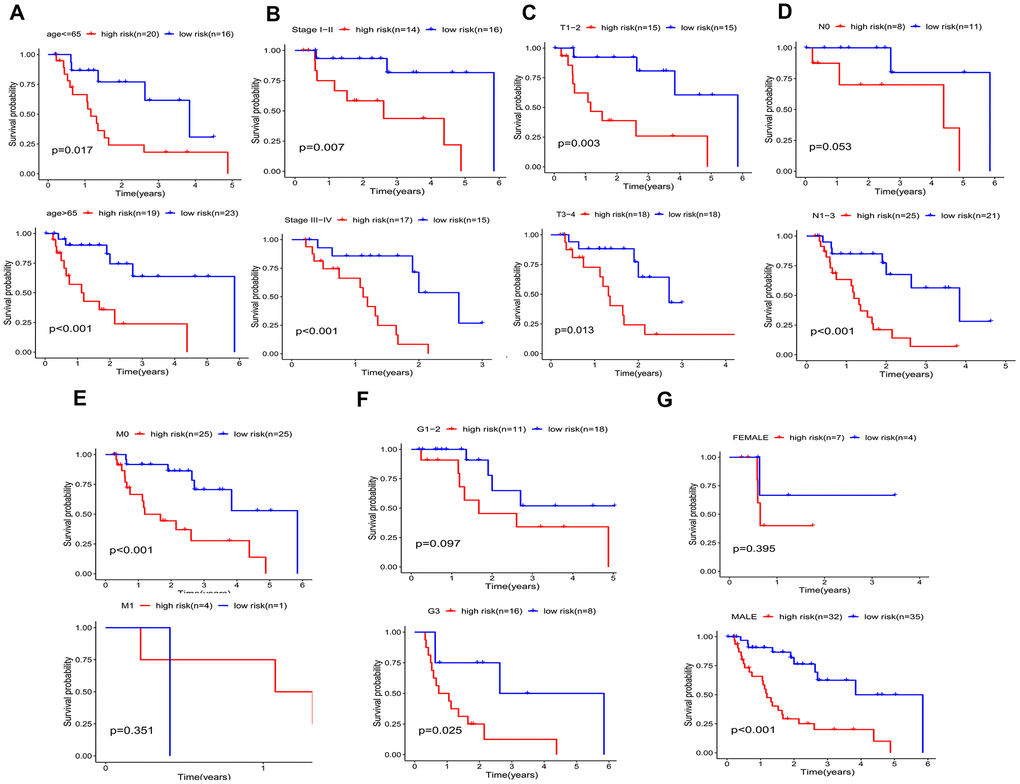
Figure 8.
Kaplan–Meier curves for prognostic value of risk-score signature for the patients divided by each clinical characteristic.
(
A
) age, (
B
) UICC stage, (
C
) T classification. (
D
) N classification, (
E
) M classification, (
F
) Grade, (
G
) gender.