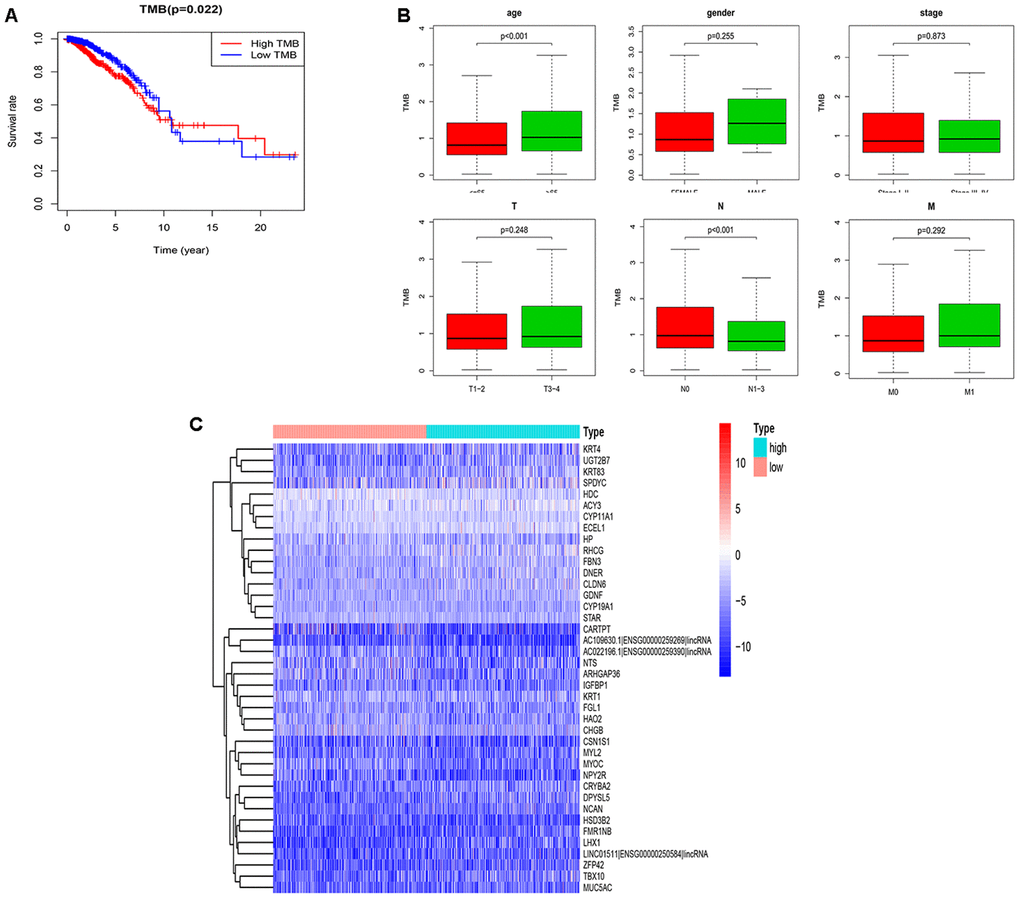
Figure 2.Performance evaluation of TMB and DEGs in the high and low TMB groups. (A) Prognosis of TMB. The survival curves of the high and low TMB groups intersect (P=0.022); (B) The associations of the clinical characteristics with TMB. Higher TMB levels were associated with over 65 years old and the N0 stage (P<0.001); (C) The top 40 DEGs are shown in the heatmap plot. TMB, tumor mutation burden; DEGs, differentially expressed genes; N0, no lymph nodes are involved.