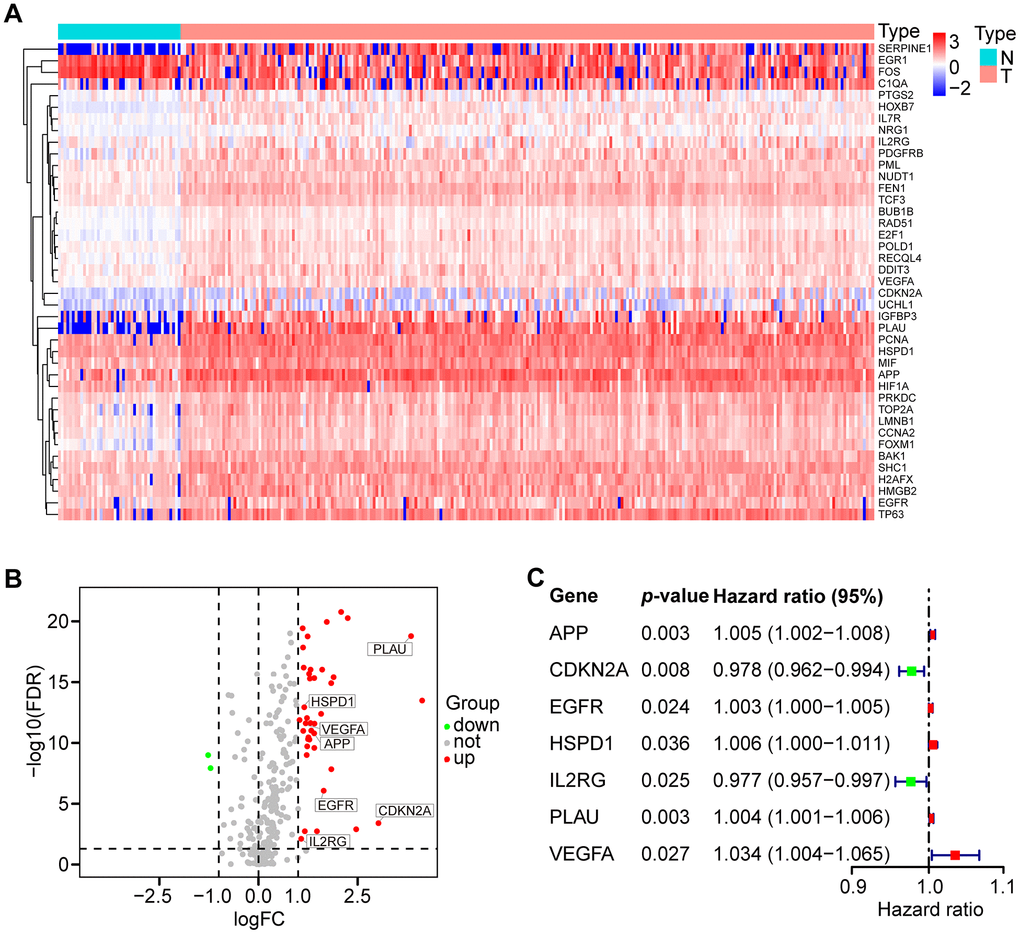
Figure 1.Differential expression of aging-related genes (AGs) and 7 AGs of prognostic risk models in HNSCC samples. (A) Hierarchical cluster heat map visualizing 41 differentially expressed AGs (DEAGs). (B) Volcano plot showing 39 upregulated and 2 downregulated DEAGs (FDR < 0.05 and |logFC| > 1). (C) Forest plot showing the characteristics of 7 risk DEAGs in the prognostic risk models.