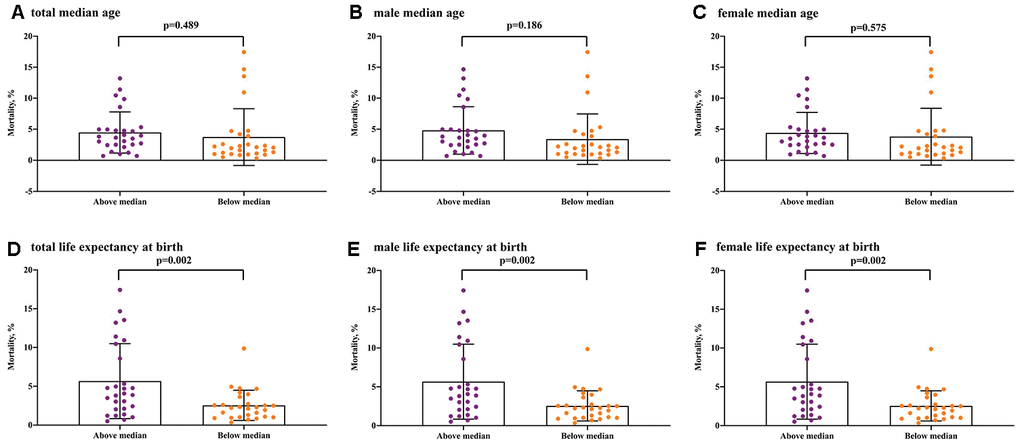
Figure 4.COVID-19 mortality for median age and life expectancy at birth in the above median group versus the below median group. (A) total median age, (B) male median age, (C) female median age, (D) total life expectancy at birth, (E) male life expectancy at birth, (F) female life expectancy at birth.