Submit an Article
Navigate
Home
Editorial Board
Editorial Policies
Current Volume
Archive
Scientific Integrity
Publication Ethics Statements
Interviews with Outstanding Authors
Newsroom
Sponsored Conferences
Podcast
Contact
Special Collections
Submit an Article
Online ISSN: 1945-4589
Research Paper
|
Volume 12, Issue 24
|
pp. 25718–25729
Central motor conduction time in spinocerebellar ataxia: a meta-analysis
Back to article
Figure 3
(3 of 4)
−
100%
+
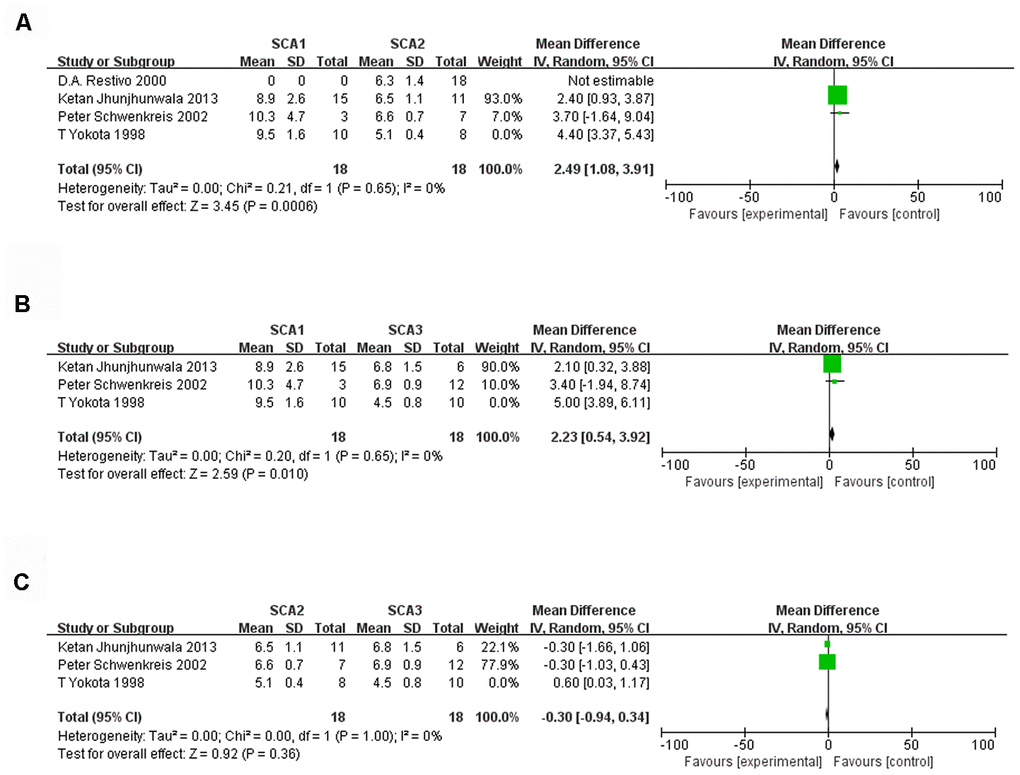
Figure 3.
Forest plot of the comparison between SCA1 and SCA2 (
A
), SCA1 and SCA3 (
B
), SCA2 and SCA3 (
C
) after sensitivity analysis.