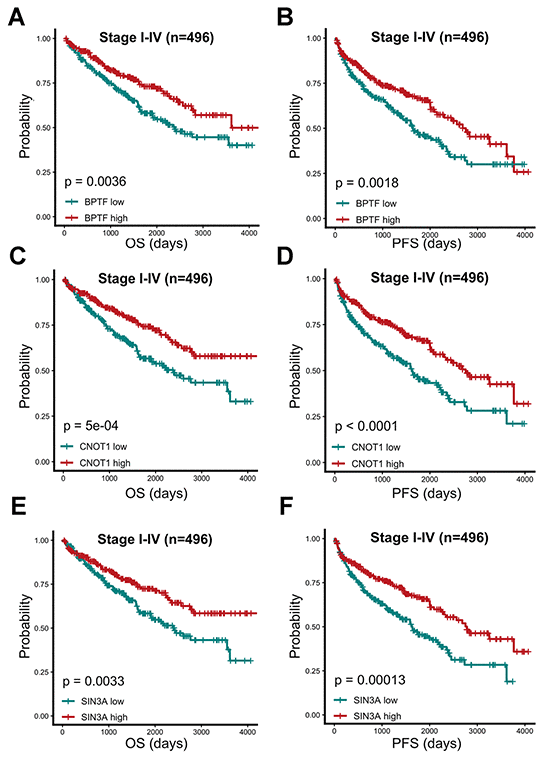
Figure 3.Prognostic analysis of three characterized chromatin-remodeling factors upon 496 TCGA-KIRC patients. Comparison of overall and progression-free prognostic differences between two groups divided by BPTF (A, B), CNOT1 (C, D) and SIN3A (E, F) expression levels based on median expression level.