Submit an Article
Navigate
Home
Editorial Board
Editorial Policies
Current Volume
Archive
Scientific Integrity
Publication Ethics Statements
Interviews with Outstanding Authors
Newsroom
Sponsored Conferences
Podcast
Contact
Special Collections
Submit an Article
Online ISSN: 1945-4589
Research Paper
|
Volume 12, Issue 24
|
pp. 25356–25372
Development and validation of a prognostic model for kidney renal clear cell carcinoma based on RNA binding protein expression
Back to article
Figure 8
(8 of 11)
−
100%
+
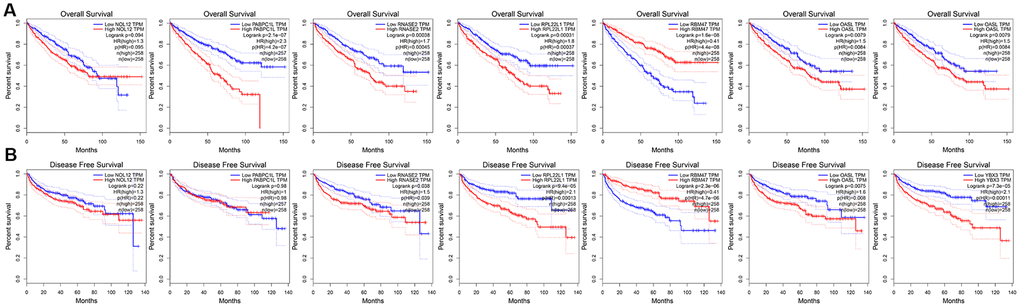
Figure 8.
Univariate survival analysis of the target RBPs using Kaplan-Meier curves.
(
A
) Relationships between RBPs and OS. (
B
) Relationships between RBPs and DFS.