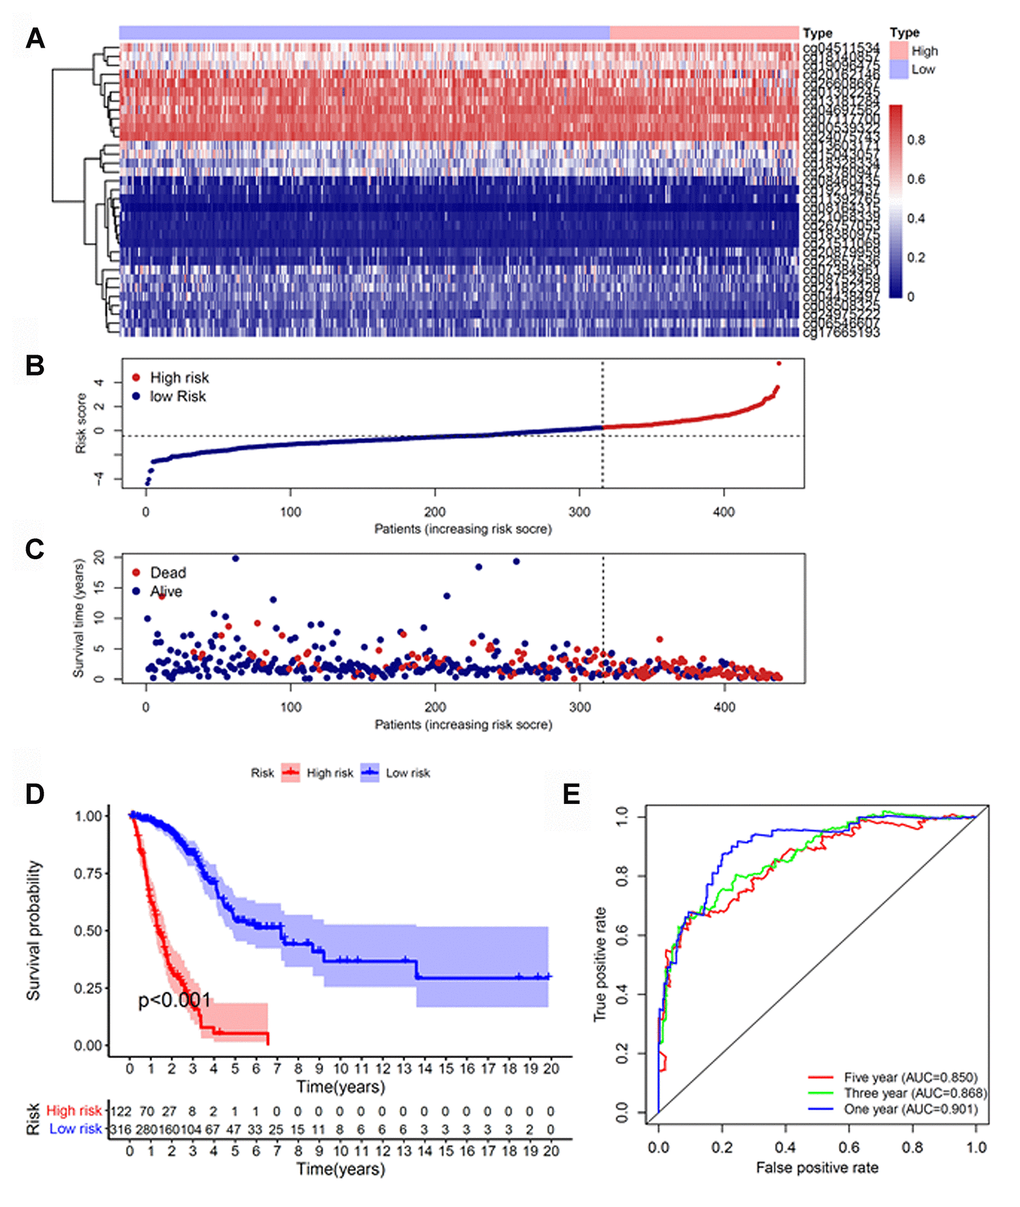
Figure 2.Construction of the prognostic methylation model for patients with LUAD. (A) The clustering analysis heatmap of methylation profile in DNA methylation signature sites. (B) The distribution of DNA methylation-based risk score. (C) Vital status of patients in the high- and low-risk groups. (D) Kaplan–Meier survival curves of the relative overall survival of patients in the high- and low-risk groups. (E) Accuracy of the prognostic model in predicting survival time by time-dependent ROC curve analysis. LUAD, lung adenocarcinoma; ROC, receiver operating characteristic.