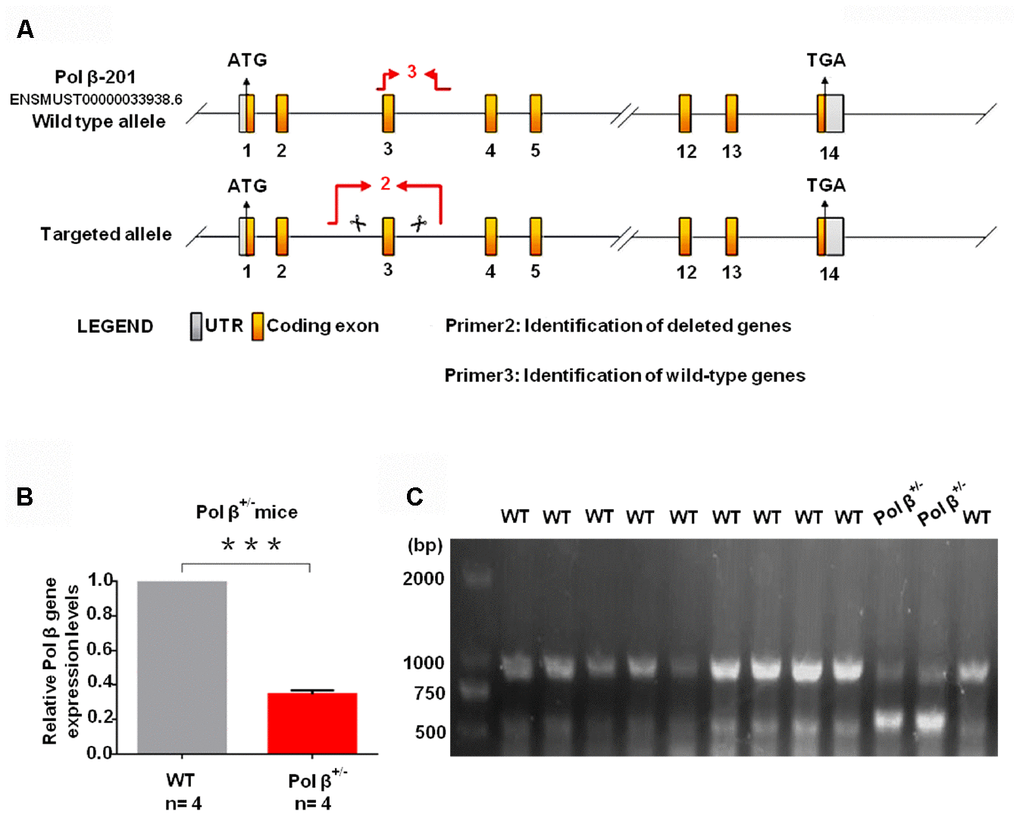
Figure 1.Pol β-deficient mouse ovarian function and impaired BER lead to ovarian aging. (A) The modeling strategy of pol β+/- mice. (B) Relative Pol β gene expression levels in Pol β-deficient mice. We observed significant Pol β deficiency in heterozygous Pol β+/- mice compared with that in wt mice (mice aged 6-8 weeks, n stands for the number of mice, ***P<0.001, Student’s t test). (C) To confirm that the Pol β fragment was deleted correctly, total RNA was extracted and Pol β cDNA was amplified via PCR.
(D) Pol β+/- mice had lower mean serum AMH concentrations than wt mice (aged 6-8 weeks) (n stands for the number of mice, ***P < 0.001, ANOVA). (E) Reduced primordial follicles per ovary (5-day ovary; n stands for the number of mice, **P < 0.01; Student’s t test); the black arrow indicates oocytes. (F) Reduced primordial follicles per ovary (4-month ovary; n stands for the number of mice, **P < 0.01, Student’s t test); the black arrow indicates oocytes; the blue arrow indicates no oocytes. (G) Reduced ovarian weight in Pol β+/- mice (Mice aged 6-8 weeks; n =8 per group; n stands for the number of ovary, *P < 0.05, Student’s t test).
(H) Scatter graphs show a lower number of oocytes yield in Pol β+/- mice compared to wt mice, (Mice aged 6-8 weeks; n =20 per group; n stands for the number of mice, ***P < 0.001, Student’s t test). (I) Pol β+/- mice also showed significantly lower meiosis II (MII) oocyte yield per female than wt mice (Mice aged 6-8 weeks; n =8 per group; n stands for the number of mice, ***P<0.001, Student’s t test). (J) Reduced litter size in Pol β+/- mice (Mice aged 6-8 weeks, n =6 per group; n stands for the number of mice, ***P < 0.001, Student’s t test). (K) In newborn mice, Pol β+/- offspring had lower mean serum AMH concentrations than wt mice (Mice aged 2 weeks, n =5 per group; n stands for the number of mice, *P < 0.05, Student’s t test). (L) Compared to wt (6-8 weeks), Pol β+/- (6-8 weeks) and wt (8 months) oocytes after treatment with different H2O2 concentrations at 30 minutes exhibited different survival (n stands for the number of oocytes, ***P<0.001, **P<0.01, Student’s t test). (M) Compared to wt (6-8 weeks), Pol β+/- (6-8 weeks) and wt (8 months) oocytes after treatment with same H2O2 concentration exhibited different survival (n stands for the number of oocytes, ***P<0.001, ***P<0.001, Student’s t test).
(N) Pol β+/- (6-8 weeks) and wt (6-8 weeks) oocytes were immunofluorescent for AC3. Pol β+/- showed a significant increase in AC3 fluorescence intensity compared to wt (n stands for the number of oocytes, **P<0.01, Student’s t test). (O) Pol β+/- (6-8 weeks) ovarian tissue showed a higher AC3 fluorescence intensity (n stands for the number of oocytes, *P < 0.05, Student’s t test). The pink arrow indicates normal oocytes; the white arrow indicates apoptotic oocytes. (P) 5-FU treatment results in ovarian tissue with greater AC3 fluorescence intensity (mice aged 6-8 weeks, n stands for the number of oocytes, ***P <0.001, Student’s t test). The pink arrow indicates normal oocytes; the white arrow indicates apoptotic oocytes (mice injected with 5-FU for 2 weeks under the safe dose of 20 mg/kg every day, Student’s t test). All scatter graphs and bar graphs show the means ± SD.