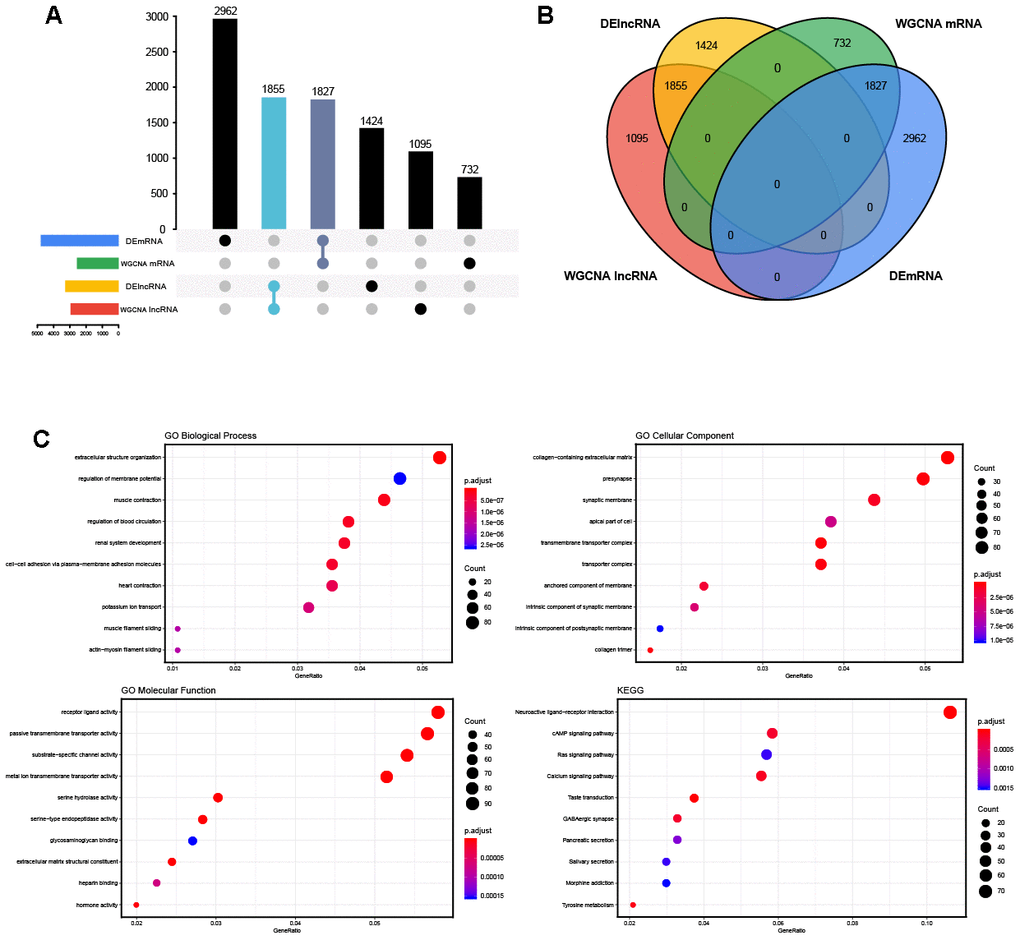
Figure 3.The overlapped genes and enrichment analysis. (A, B) The Venn diagram and the UpSet plots of overlapped genes between differential expression analysis and weighted correlation network analysis. (C) The top 10 significantly enriched Gene Ontology (GO) biological process (BP) terms, cellular component (CC) terms, molecular function (MF) terms and the Kyoto Encyclopedia of Genes and Genomes (KEGG) pathways.