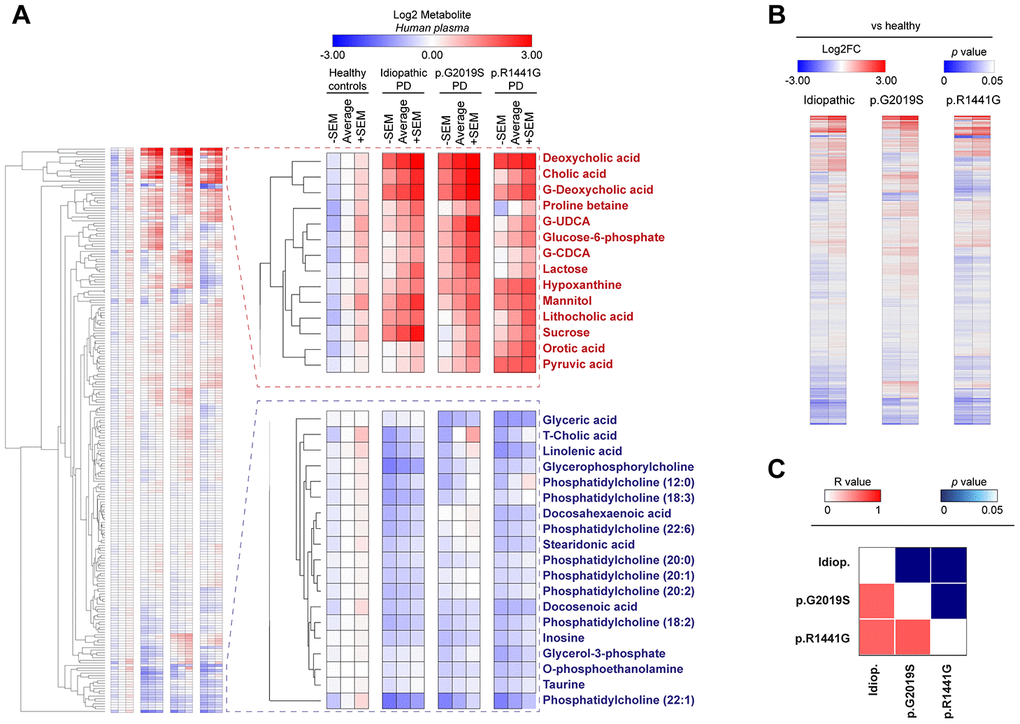
Figure 1.Heatmap clustered by Euclidean distance of changes in plasma metabolite concentrations depicted as Log2 in the control group (healthy), idiopathic and familial (carrying the p.G2019S or p.R1441G mutations in LRRK2 gene) Parkinson’s disease (PD) patients (A) or Log2-fold change between each PD group respect to control group (B). Correlation matrix of all plasma metabolites changed in PD patients is shown by color codes (p values and Pearson’s coefficients of correlation ®) (C).