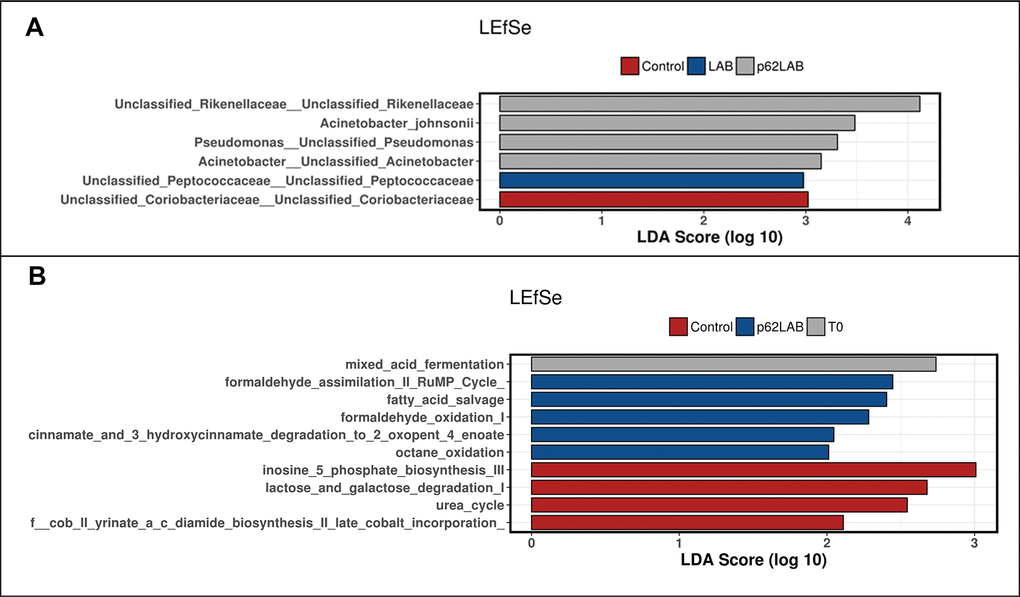
Figure 9.Linear discriminant analysis effect size (LefSe) of bacterial taxa and KEEG pathways. LefSe of bacterial taxa and their association with C, LAB and p62-LAB groups. Only LefSe values >2 are shown (panel A). LEfSe of the differentially abundant KEGG pathways in T0, C and p62-LAB groups. Only LefSe values >2 are shown (panel B).