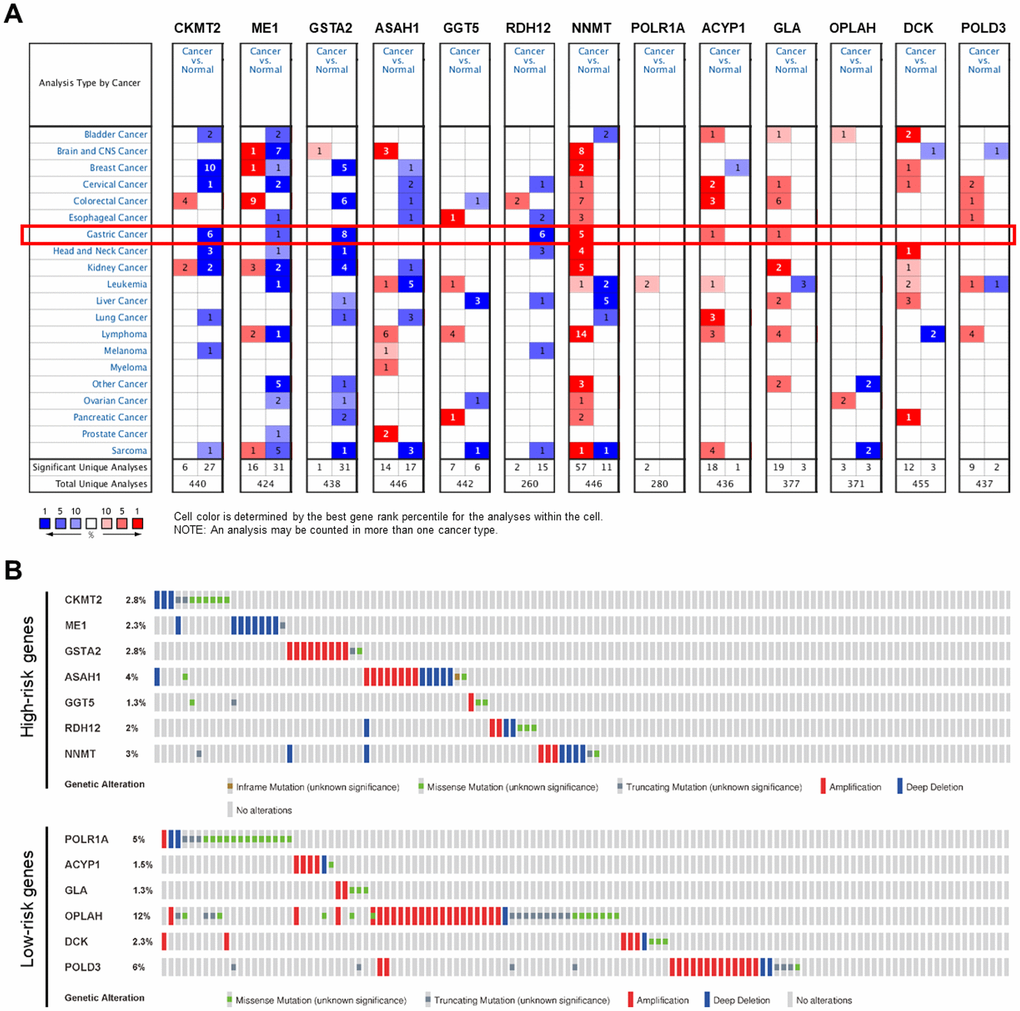
Figure 9.Genetic alterations of the PDEMRGs. (A) The expression profiles of the PDEMRGs in the Oncomine database. Red represents over-expressed; blue represents under-expressed. (B) Genetic alterations of the PDEMRGs from cBioportal for Cancer Genomics.