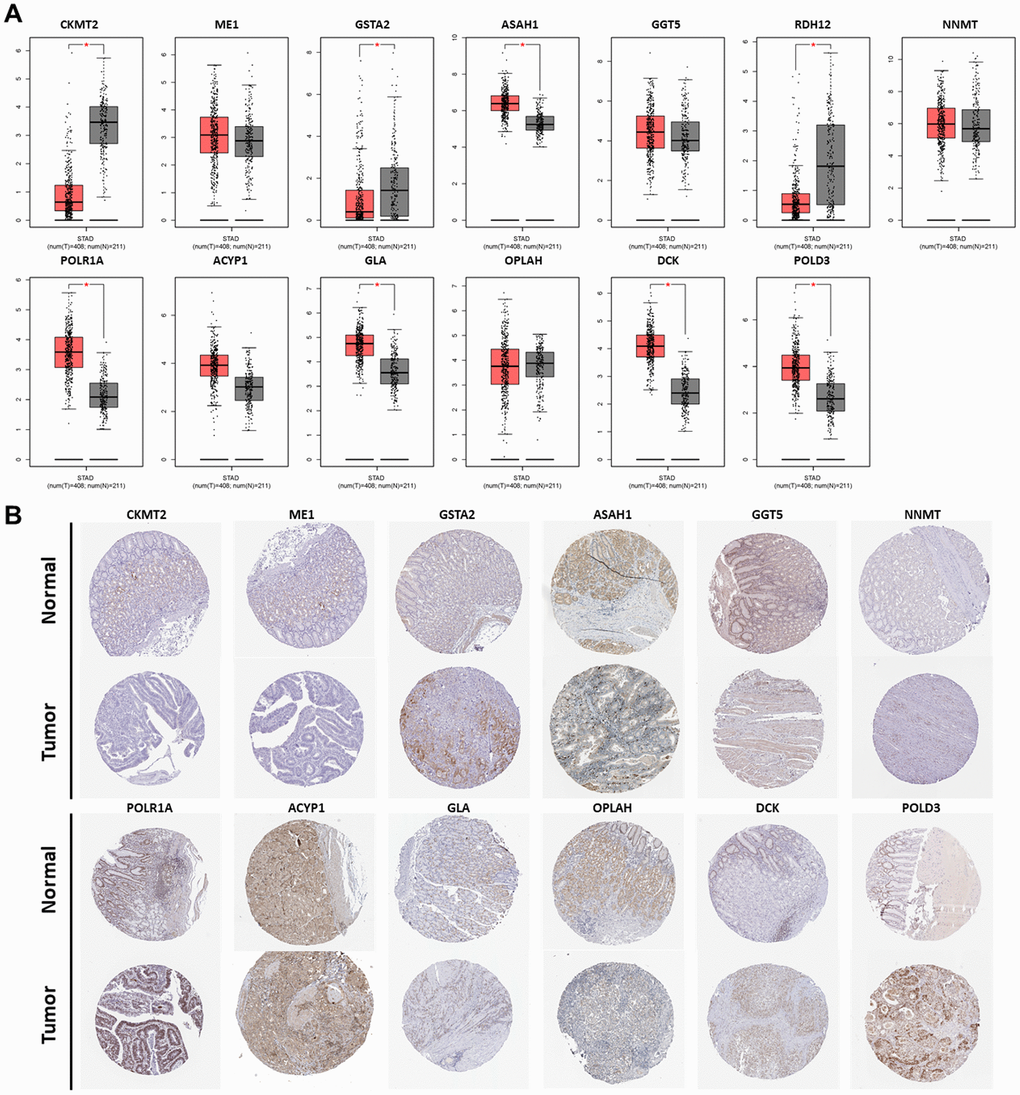
Figure 8.Expression of the PDEMRGs. (A) The mRNA expression levels of the PDEMRGs in GC and normal gastric tissue (*P < 0.05). Red represents GC and gray represents normal gastric tissue. (B) The representative protein expression of the PDEMRGs in GC and normal gastric tissue.