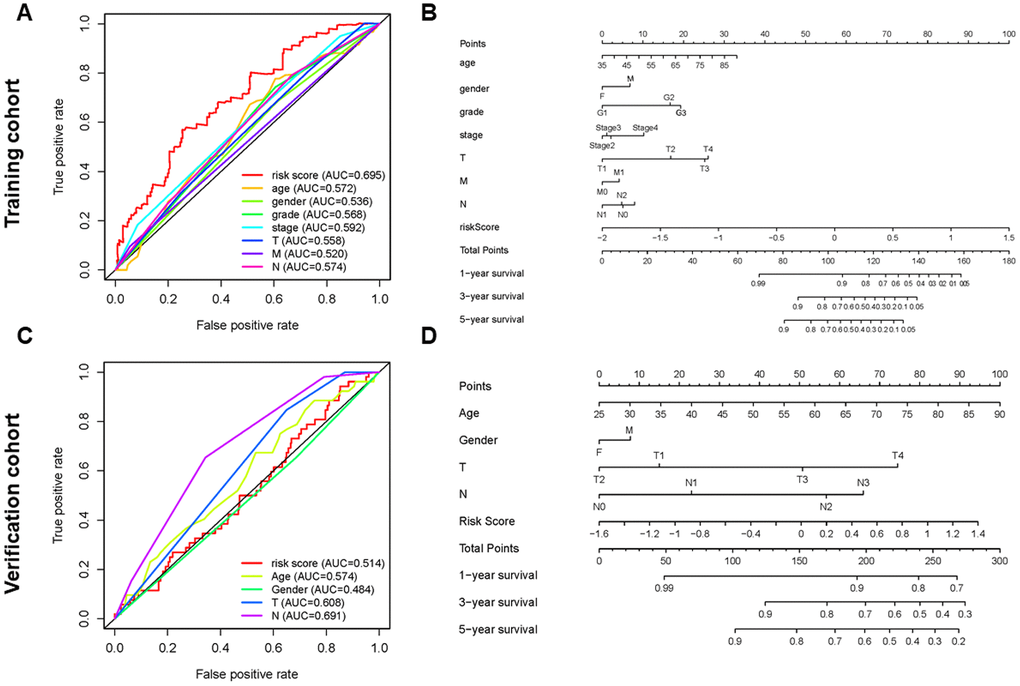
Figure 5.Establishment of ROC curves and nomograms. (A, C) ROC curves (receiver operating characteristics) of the risk score and other clinical indices. (B, D) The nomogram was established based on the independent prognosis model.
Figure 5 — Identification and prognostic value of metabolism-related genes in gastric cancer | Aging