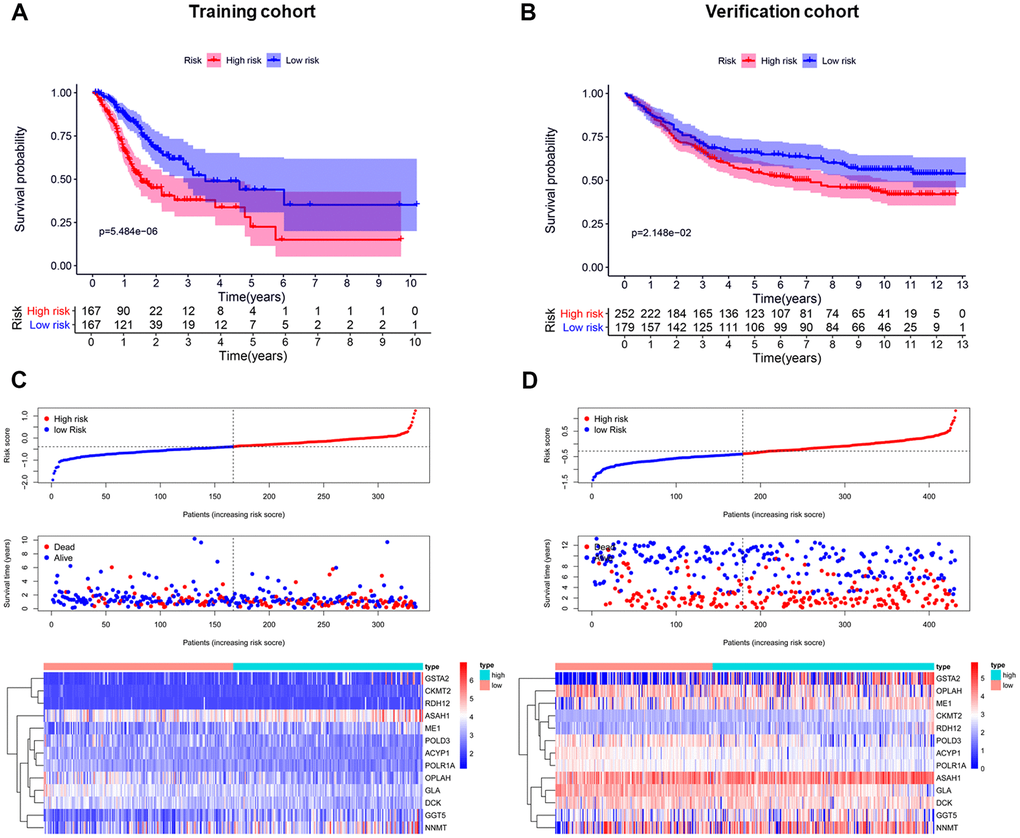
Figure 3.Establishment and validation of the prognostic risk model. (A, B) Kaplan-Meier curve analysis of the high-risk and low-risk groups. (C, D) From top to bottom=Risk score distribution of patients. Survival status scatter plots of patients. Expression patterns of risk genes.