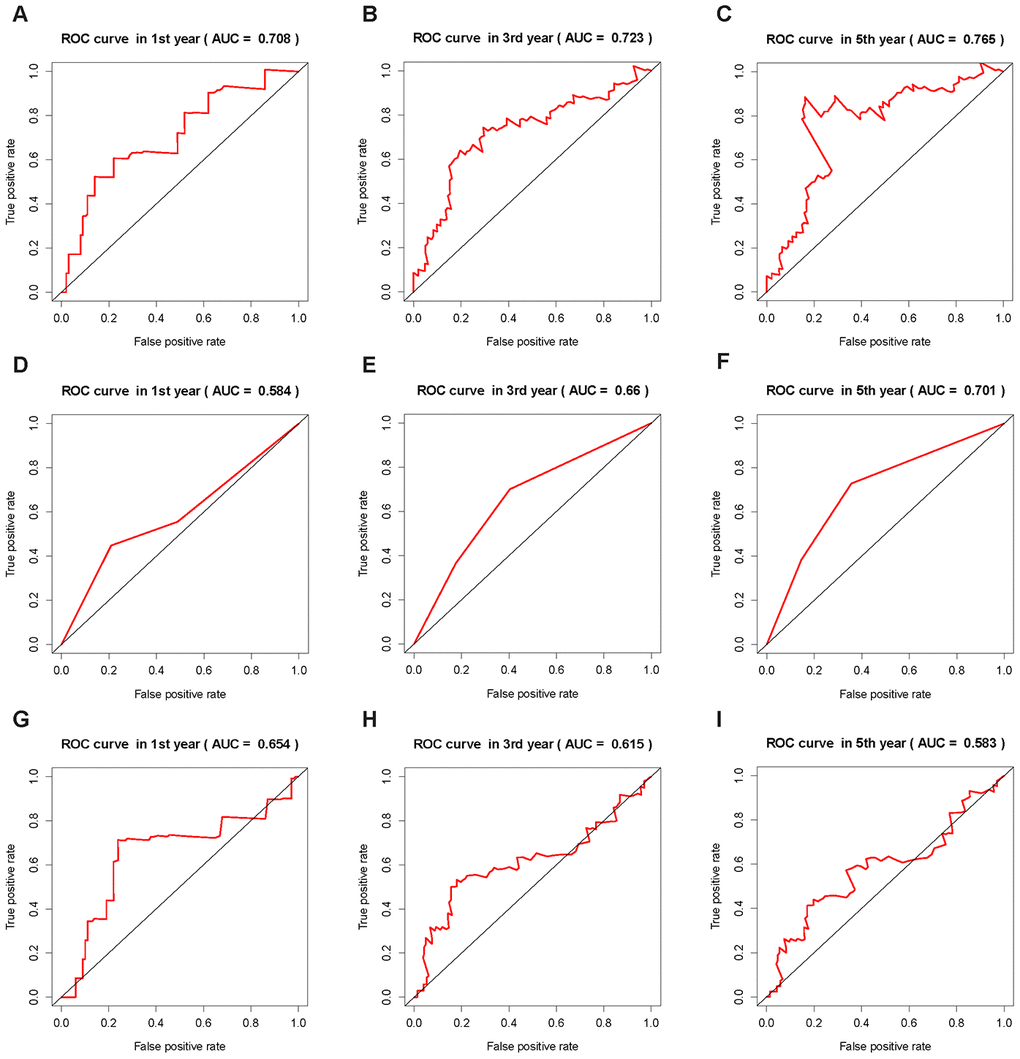
Figure 5.ROC curves of the ICRP score, AJCC stage, and ALBI score. The AUC value is in brackets. (A–C) ROC curves of ICRP score’s forecast result after 1, 3, and 5 years in the test set. (D–F) ROC curves of AJCC stage forecast result after 1, 3, and 5 years in the test set. (G–I) ROC curves of ALBI score prediction results after 1, 3, and 5 years in the test set.