Submit an Article
Navigate
Home
Editorial Board
Editorial Policies
Current Volume
Archive
Scientific Integrity
Publication Ethics Statements
Interviews with Outstanding Authors
Newsroom
Sponsored Conferences
Podcast
Contact
Special Collections
Submit an Article
Online ISSN: 1945-4589
Research Paper
|
Volume 12, Issue 16
|
pp. 16555–16578
Prognostic model of patients with liver cancer based on tumor stem cell content and immune process
Back to article
Figure 3
(3 of 7)
−
100%
+
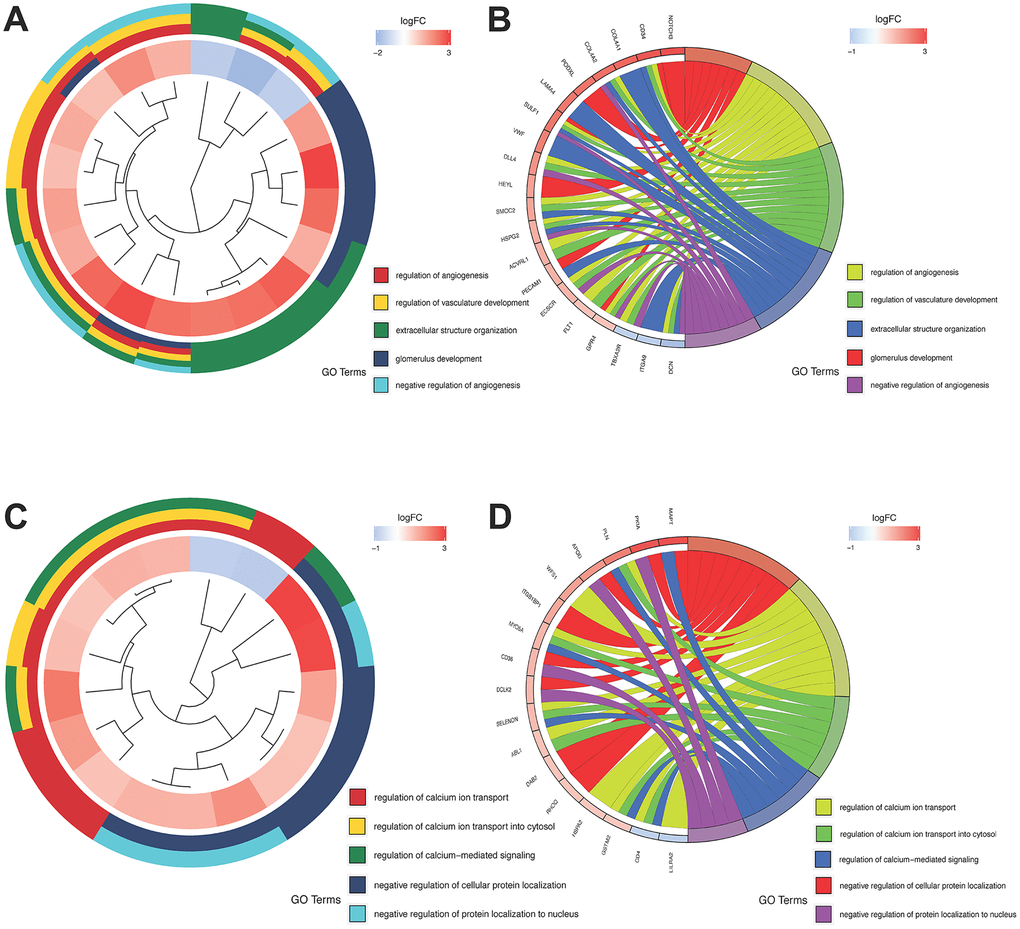
Figure 3.
GO analysis of the salmon and pink modules.
(
A
and
B
) GO analysis of the salmon module; (
C
and
D
) GO analysis of the pink module.
Figure 3 — Prognostic model of patients with liver cancer based on tumor stem cell content and immune process | Aging