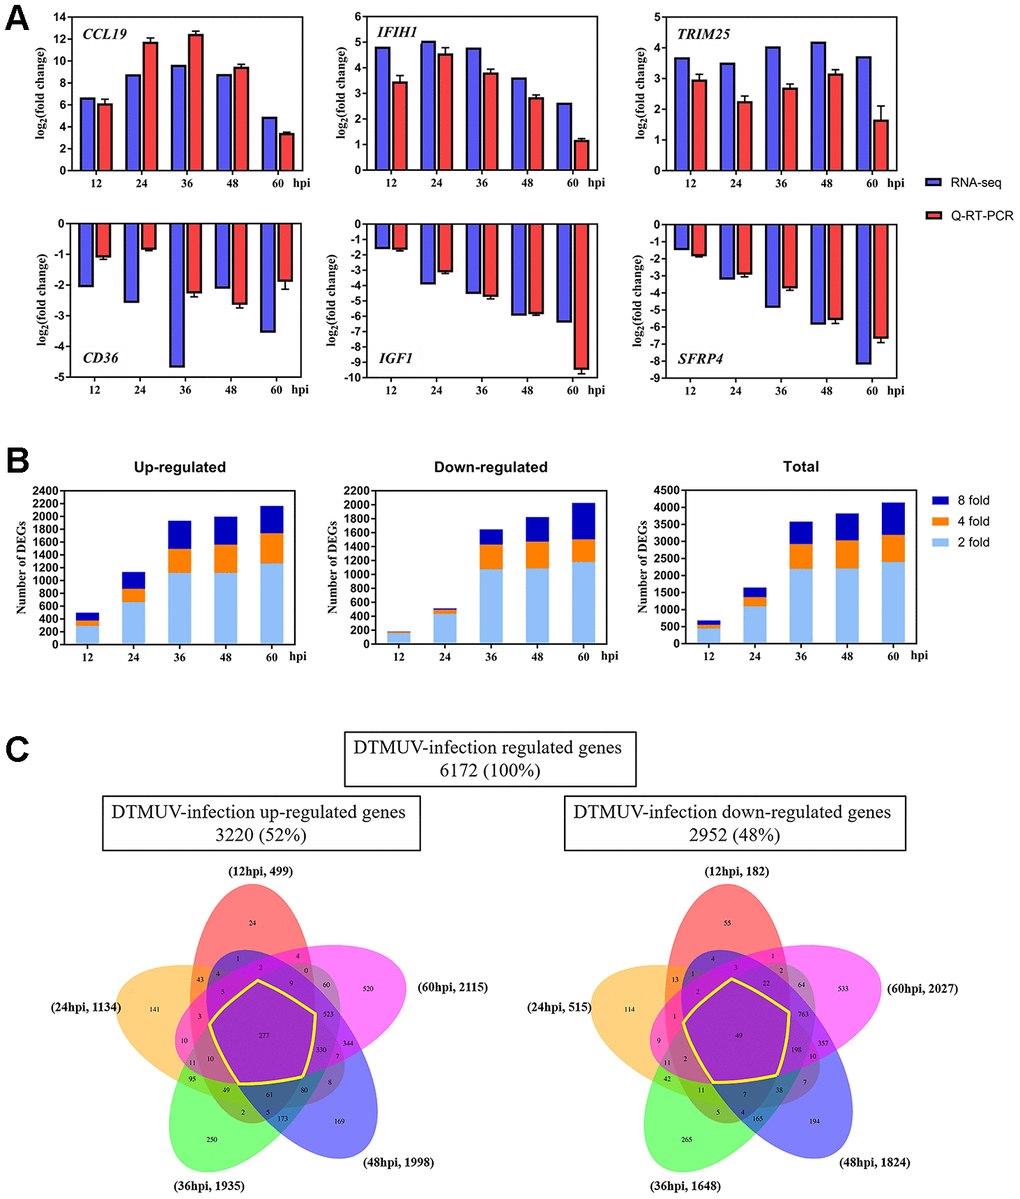
Figure 2.Changes of the gene expression in DEFs at different times after DTMUV infection. (A) Q-RT-PCR versus RNA-seq analyses of the expression for representative six genes (CCL19, IFIH1, TRIM25, CD36, IGF1 and SFRP4). (B) The upregulated/downregulated number and total number of DEGs (≥ twofold change, P<0.05) at 12, 24, 36, 48 and 60 hpi. (C) Venn diagrams showing overlap of DTMUV-induced DEGs across different time points. Upregulated and downregulated genes were analyzed separately and have been shown with the number of genes specifically or commonly responsive at different time points.