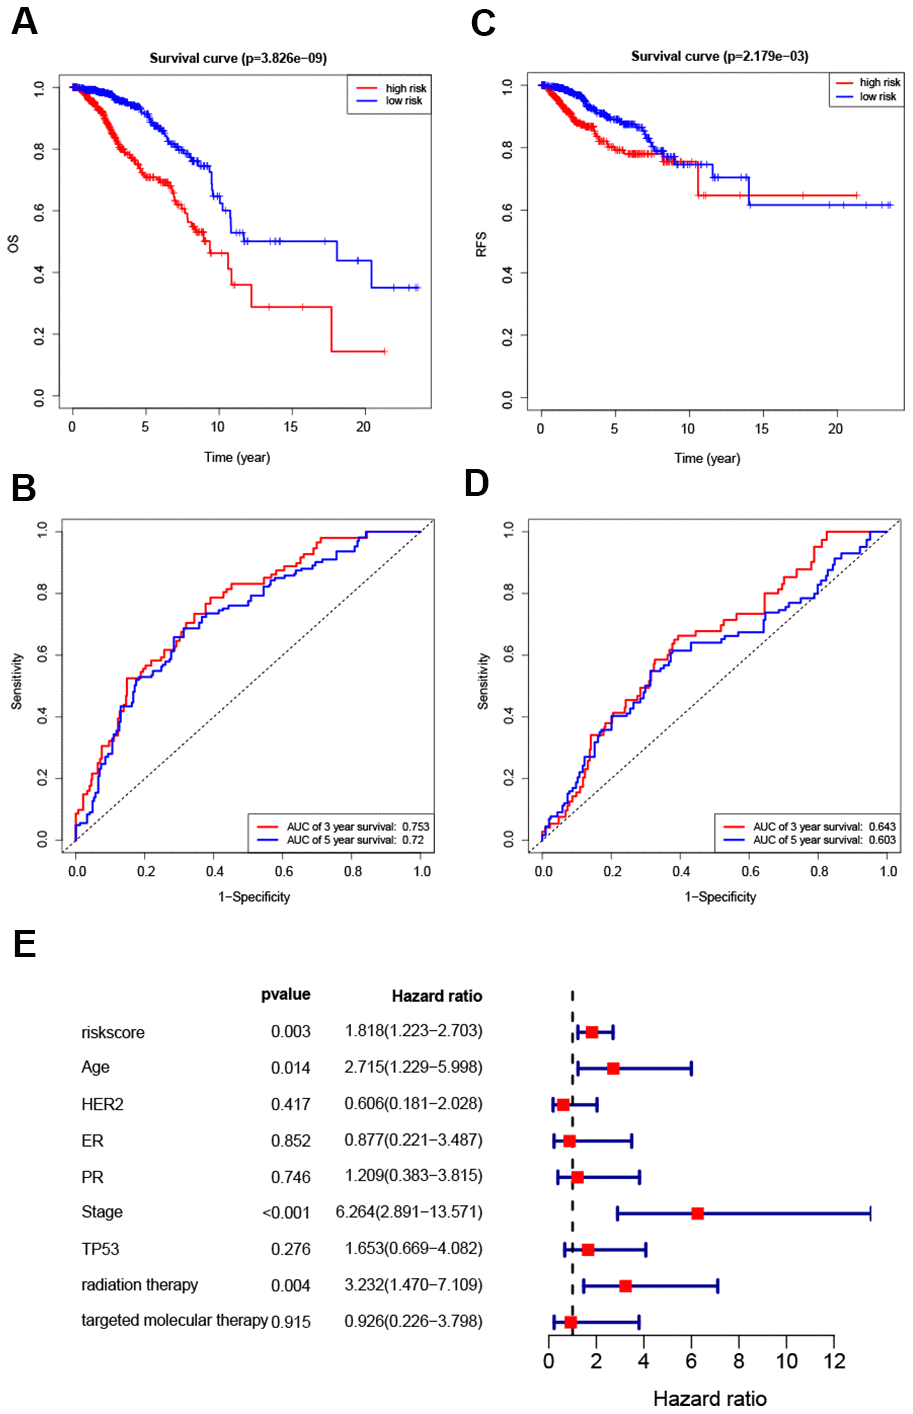
Figure 5.Survival analysis of high- and low-risk breast cancer patients. (A, B) Analysis of OS in high- and low-risk breast cancer patients. (C, D) Analysis of RFS in high- and low-risk breast cancer patients. (E) Hazard ratio of the eight-gene signature and important clinical variables.