Submit an Article
Navigate
Home
Editorial Board
Editorial Policies
Current Volume
Archive
Scientific Integrity
Publication Ethics Statements
Interviews with Outstanding Authors
Newsroom
Sponsored Conferences
Podcast
Contact
Special Collections
Submit an Article
Online ISSN: 1945-4589
Research Paper
|
Volume 12, Issue 16
|
pp. 16491–16513
Eight immune-related genes predict survival outcomes and immune characteristics in breast cancer
Back to article
Figure 3
(3 of 10)
−
100%
+
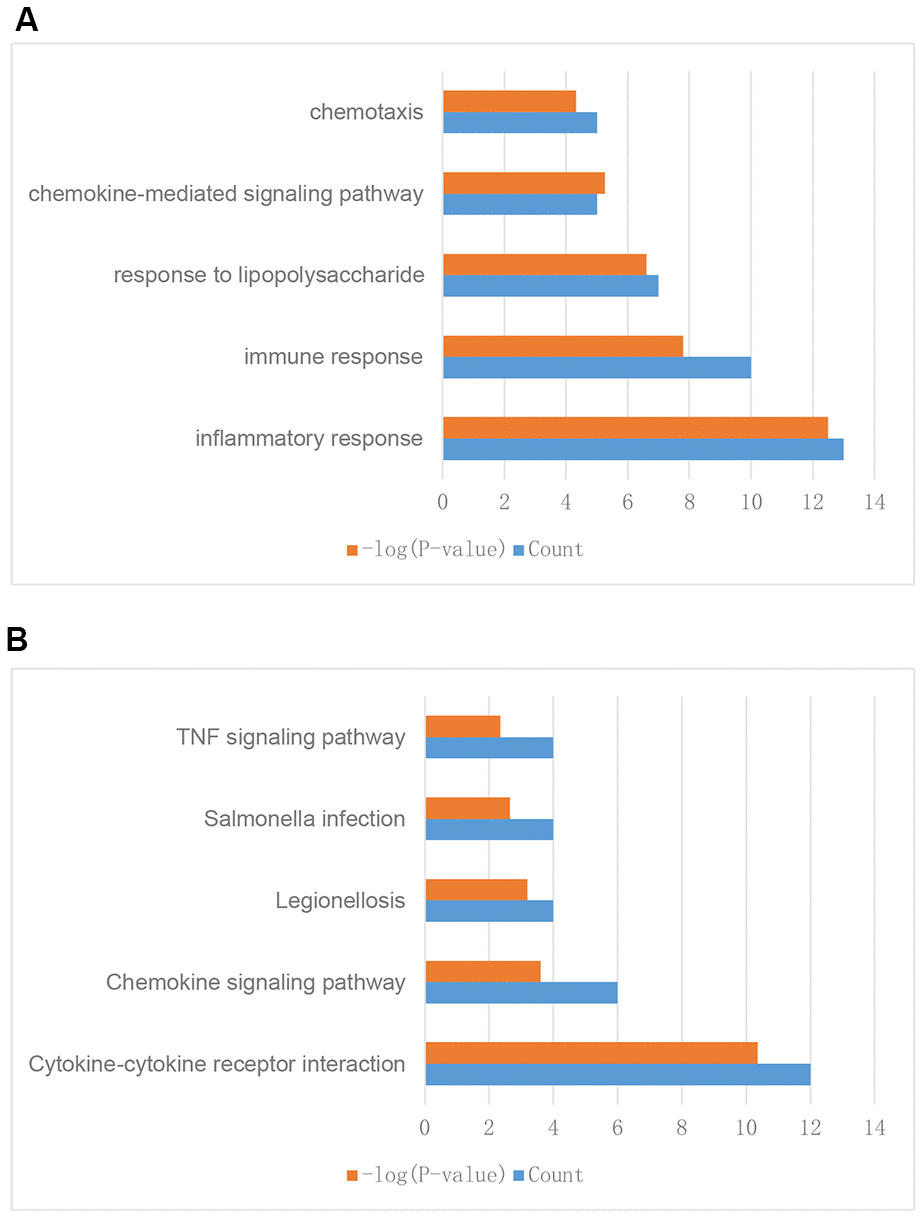
Figure 3.
Enrichment analysis of differentially expressed IRGs between breast tumor and normal breast tissues.
(
A
) GO enrichment analysis results. (
B
) KEGG enrichment analysis results.