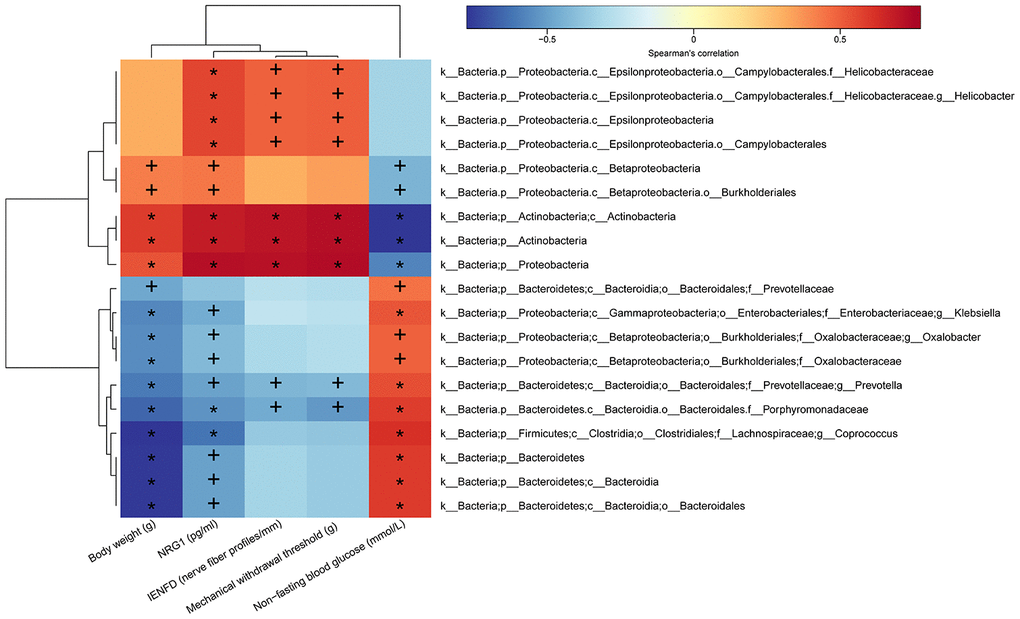
Figure 8.Heatmap of correlations between gut microbiota abundance and DPN phenotypes and serum NRG1 level. The intensity of the color represents the r-value of Spearman’s correlations (negative score, blue; positive score, red) between the relative abundance of the species and DPN phenotypes and serum NRG1 level, n=8/group, +p < 0.05, *p < 0.01.