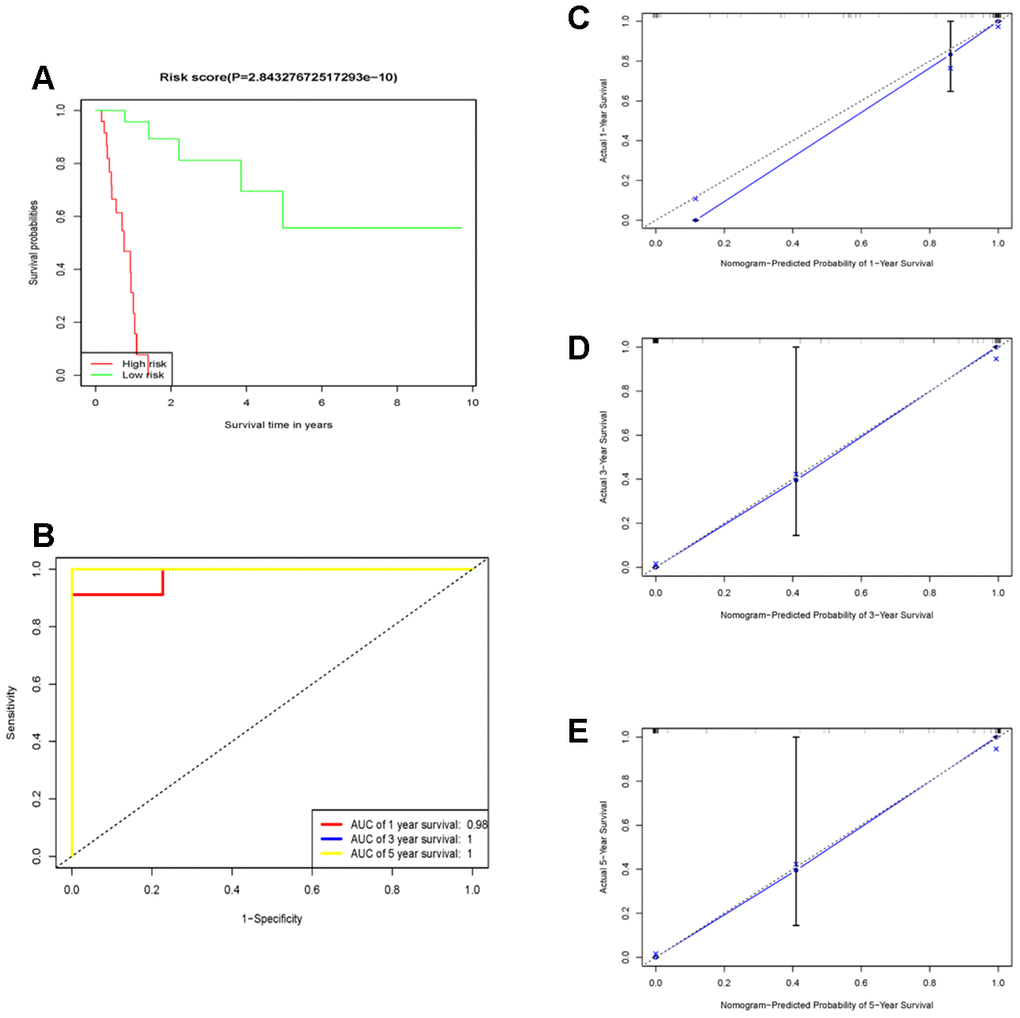
Figure 4.The prognostic performance of the 10 genes model in the TCGA-STAD. (A) Survival analysis of the high-risk group and the low-risk group using Kaplan–Meier curves. (B) The prognostic efficiency of the 10 genes model for survival time. ROC curves of the 10 genes signature for predicting 1-, 3 -and 5- year survival were analyzed. (C–E) The comparison between predicted and actual outcome for 1-, 3-, and 5-year survival probabilities was showed in the calibration plots.