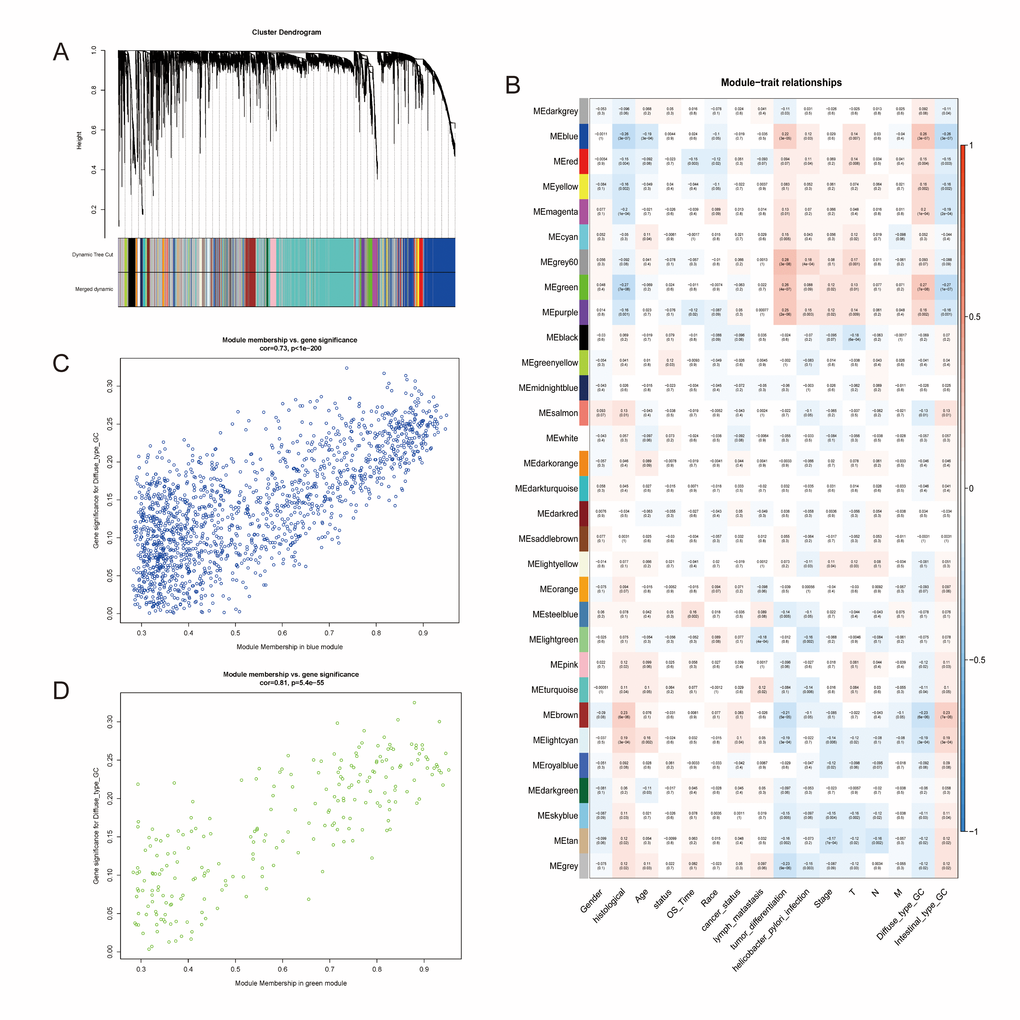
Figure 2.Identification of modules associated with the diffuse type GC. (A) Dendrogram of 9752 genes clustered based on a dissimilarity measure (1-TOM). (B) Correlation of module eigengenes with all traits. Each unit contains the corresponding correlation coefficient and P-value. The table is color-coded by correlation according to the color legend. (C, D) Scatter diagrams between blue and green modules and diffuse type GC.