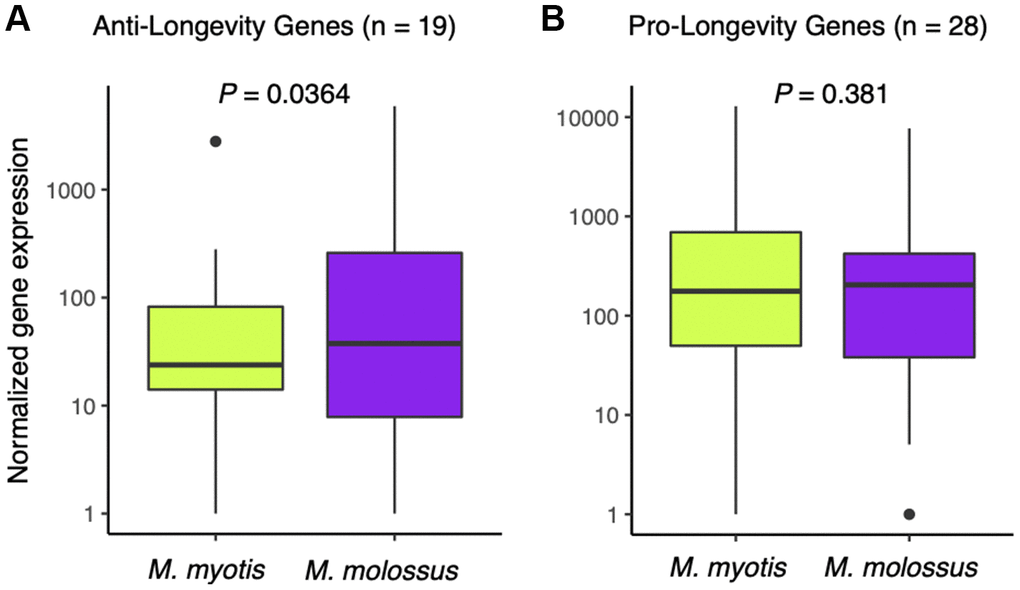
Figure 5.Expression analysis of anti- and pro-longevity genes between M. myotis and M. molossus. (A) Comparison of anti-longevity gene expression (n = 19) between M. myotis and M. molossus using Wilcoxon signed-rank test (paired mode, one-tailed test). (B) Comparison of pro-longevity gene expression (n = 28) between M. myotis and M. molossus using Wilcoxon signed-rank test (paired mode, one-tailed test).