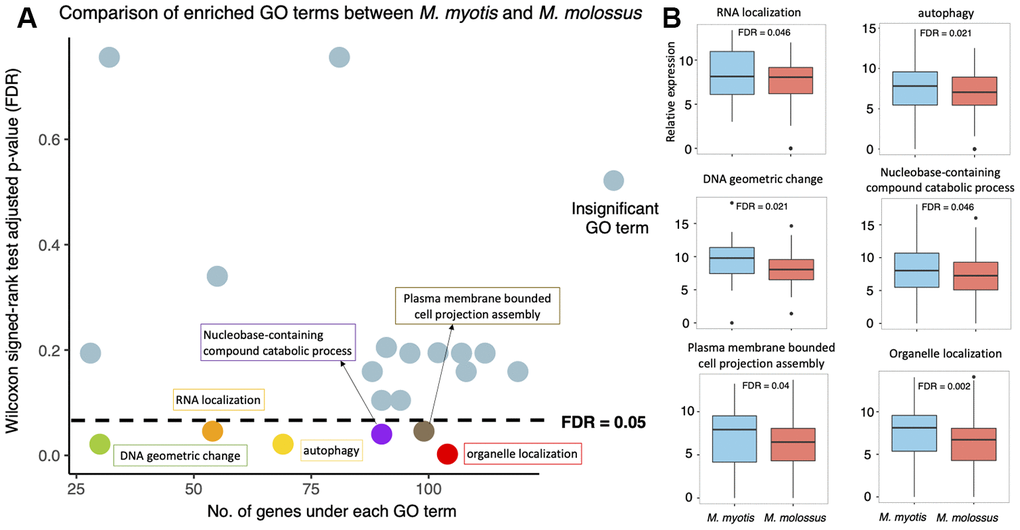
Figure 4.Expression analysis of the 20 GO terms between M. myotis and M. molossus. (A) Differential expression analysis of GO terms enriched by 2,086 genes that showed >80% interspecific expression variation. Differentially expressed GO terms were determined by comparing gene expression under each GO term using Wilcoxon signed-rank test (paired mode; one-tailed test). GO terms with FDR < 0.05 were considered differentially expressed. (B) Distribution of gene expression under each of 6 differentially expressed GO terms between M. myotis and M. molossus.