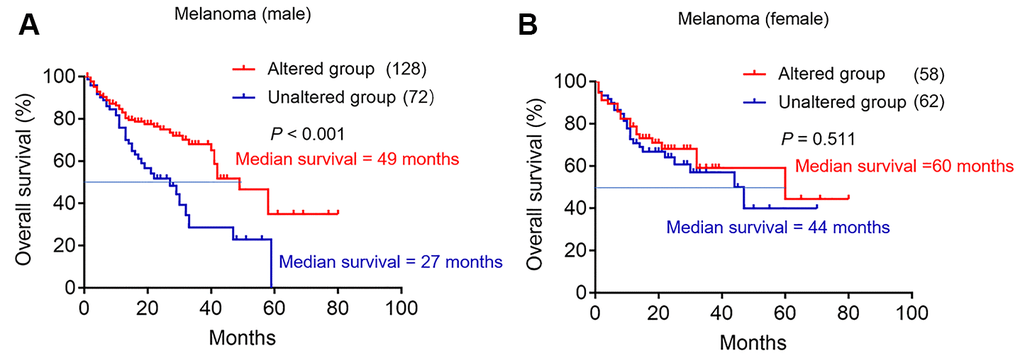
Figure 3.The effect of TERT mutation on the efficacy of immunotherapy in melanoma database. (A) Kaplan-Meier survival analysis between TERT altered and unaltered group in the male cohort. The red curve represents TERT altered group, and the blue curve represents unaltered group. (B) Kaplan-Meier survival analysis between TERT altered and unaltered group in the female cohort. The red curve represents TERT altered group, and the blue curve represents unaltered group.