Submit an Article
Navigate
Home
Editorial Board
Editorial Policies
Current Volume
Archive
Scientific Integrity
Publication Ethics Statements
Interviews with Outstanding Authors
Newsroom
Sponsored Conferences
Podcast
Contact
Special Collections
Submit an Article
Online ISSN: 1945-4589
Research Paper
|
Volume 12, Issue 17
|
pp. 17167–17208
SNAI1 is a prognostic biomarker and correlated with immune infiltrates in gastrointestinal cancers
Back to article
Figure 5
(5 of 6)
−
100%
+
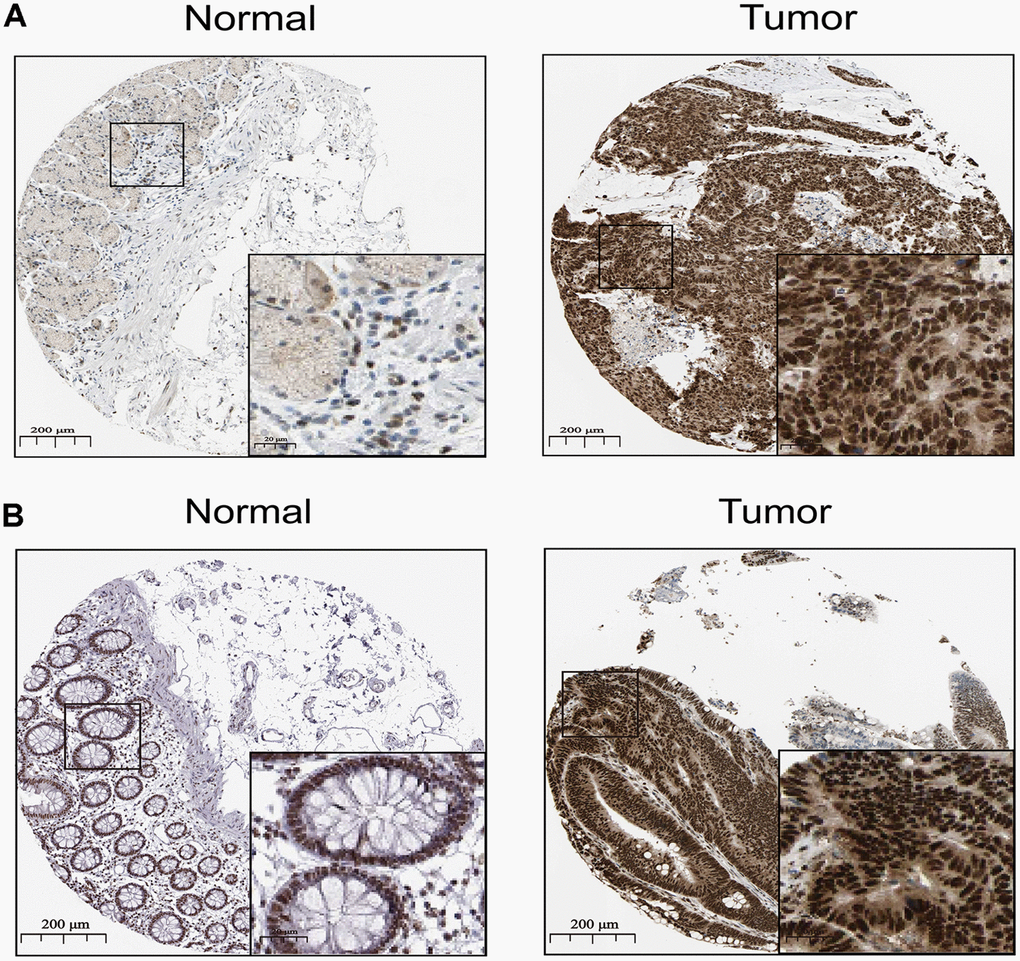
Figure 5.
The distribution of SNAI1 in cancer.
(
A
,
B
) Representative IHC images of SNAI1 expression in normal stomach tissues, stomach cancer tissues(A), normal tissues, and colorectal cancer tissues (
B
).