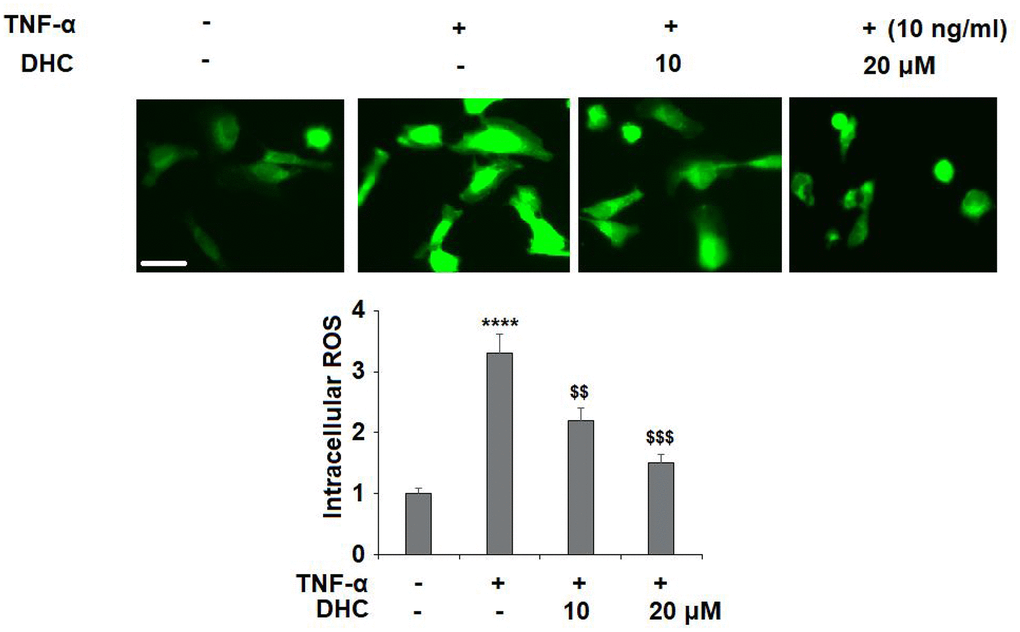
Figure 2.DHC ameliorated TNF-α-induced oxidative stress in chondrocytes. Cells were stimulated with TNF-α (10 ng/ml) in the presence or absence of 10 and 20 μM for 24 h. Intracellular ROS was measured by DCFH-DA staining. Scale bar, 100 μm (****, P<0.0001 vs. vehicle group; $$, $$$$, P<0.01, 0.0001 vs. TNF-α treatment group).