Submit an Article
Navigate
Home
Editorial Board
Editorial Policies
Current Volume
Archive
Scientific Integrity
Publication Ethics Statements
Interviews with Outstanding Authors
Newsroom
Sponsored Conferences
Podcast
Contact
Special Collections
Submit an Article
Online ISSN: 1945-4589
Research Paper
|
Volume 12, Issue 16
|
pp. 16238–16254
Prognostic values of GPNMB identified by mining TCGA database and STAD microenvironment
Back to article
Figure 5
(5 of 8)
−
100%
+
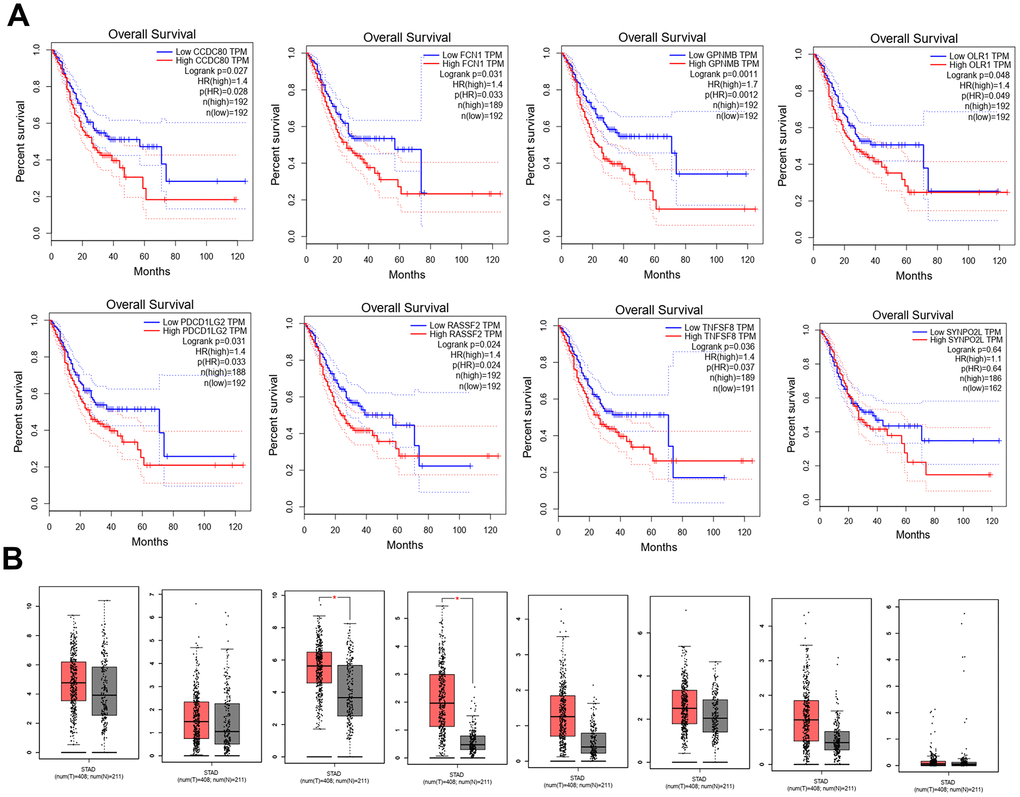
Figure 5.
Kaplan-Meier plots the 8 hub genes by R v3.5.1 from TCGA database.
(
A
) The different expression levels of 8 hub genes expression between normal and tumor from TCGA (
B
).