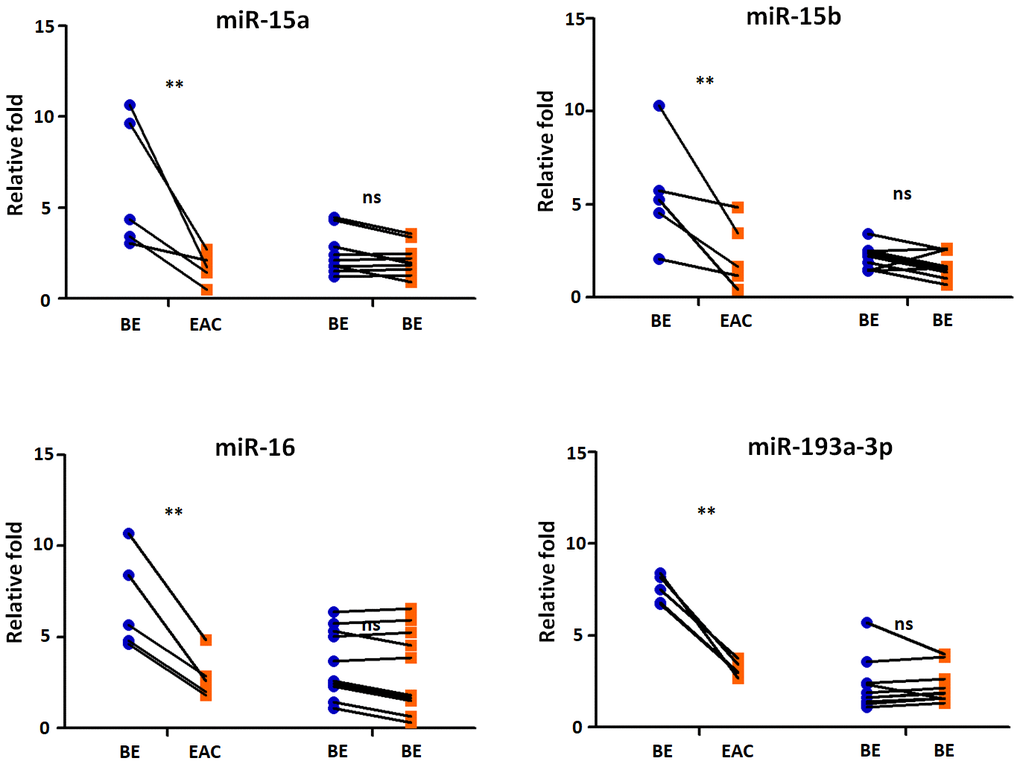
Figure 5.Exosomal miRNAs expression correlates with BE-EAC progression. TaqMan real-time RT-PCR to validate the expression levels of miR-15a, -15b, -16, and -193a-3p using 5 BE-EAC patients and 10 BE-BE patients. Data shown are as mean ± SD.
Figure 5 — Evidence that dysplasia related microRNAs in Barrett’s esophagus target PD-L1 expression and contribute to the development of esophageal adenocarcinoma | Aging