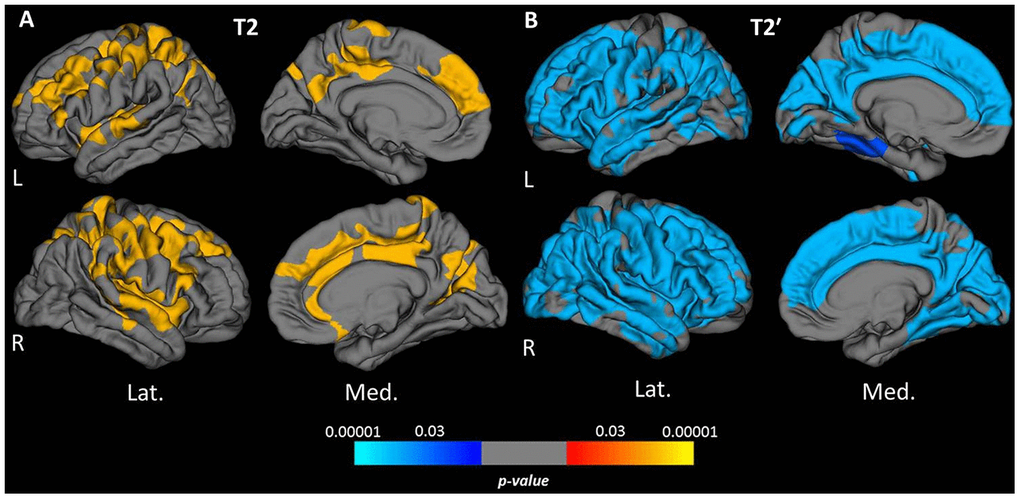
Figure 3.Cortical clusters exhibiting a significant relationship between age and cortical quantitative T2 (A) and T2′ values (B). The scale bar displays the level of significance. Hot colors demonstrate a positive and cold colors a negative association with age in the respective regions. L: left; R: right; Lat.: lateral; Med.: medial.