Submit an Article
Navigate
Home
Editorial Board
Editorial Policies
Current Volume
Archive
Scientific Integrity
Publication Ethics Statements
Interviews with Outstanding Authors
Newsroom
Sponsored Conferences
Podcast
Contact
Special Collections
Submit an Article
Online ISSN: 1945-4589
Research Paper
|
Volume 12, Issue 17
|
pp. 16981–16998
Annotation of susceptibility SNPs associated with atrial fibrillation
Back to article
Figure 3
(3 of 6)
−
100%
+
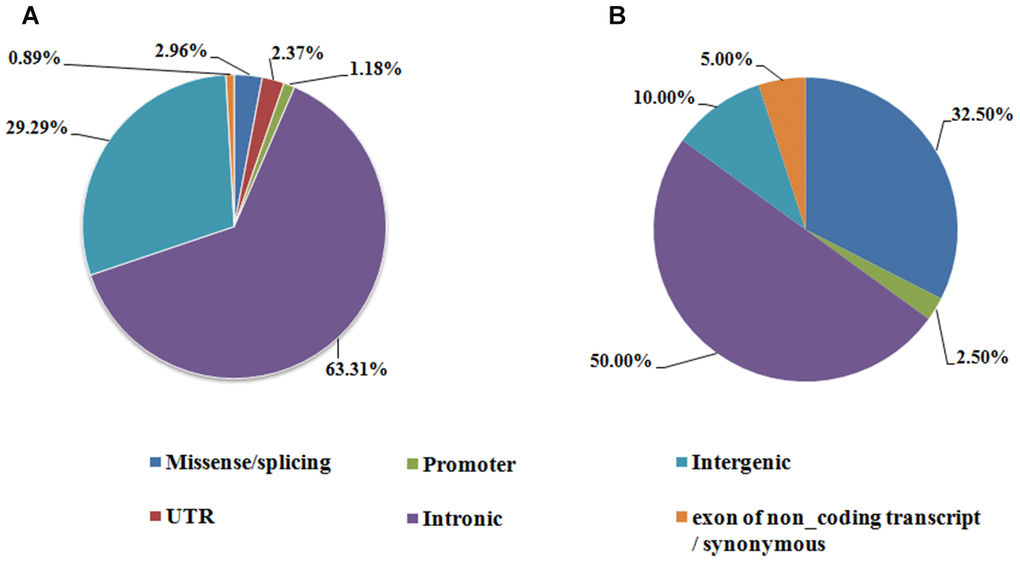
Figure 3.
Genomic region annotation distribution of the AF susceptibility SNPs.
(
A
) Index SNPs associated with AF identified in GWAS, (
B
) AF susceptibility SNPs identified by candidate gene based analysis.