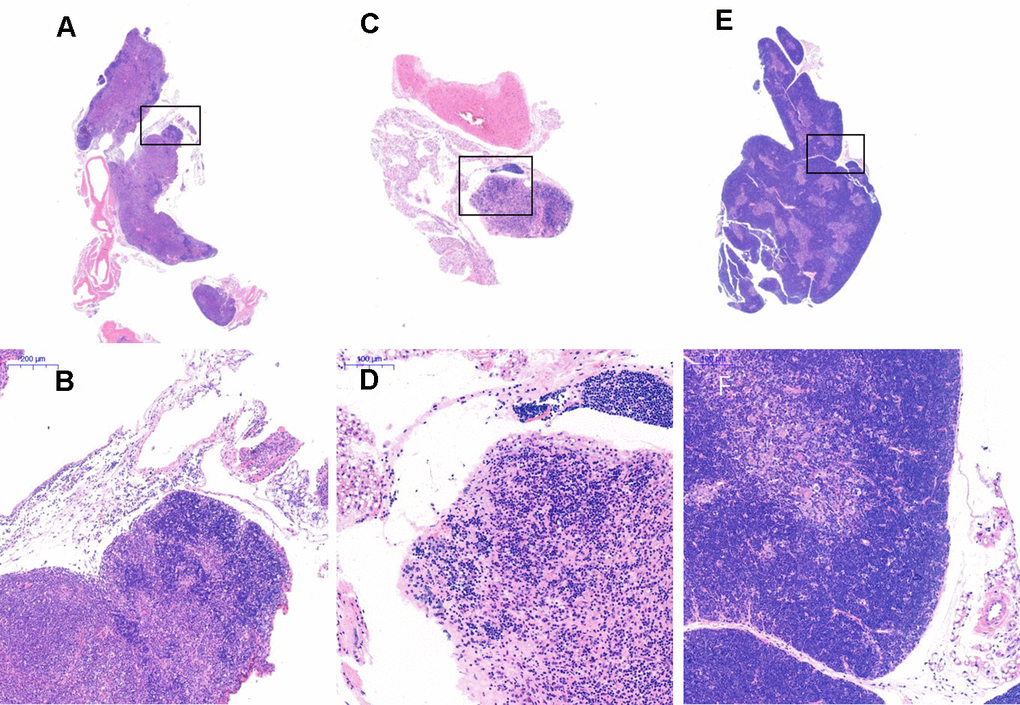
Figure 9.Thymus tissue structure changes. Note: (A, B) show the treatment group after 1 month (20×, 200×); (C, D) show the model control group (20×, 200×). The thymus tissue of the model control group was reduced in size and unclear; (E, F) show the young control group (20×, 200×).