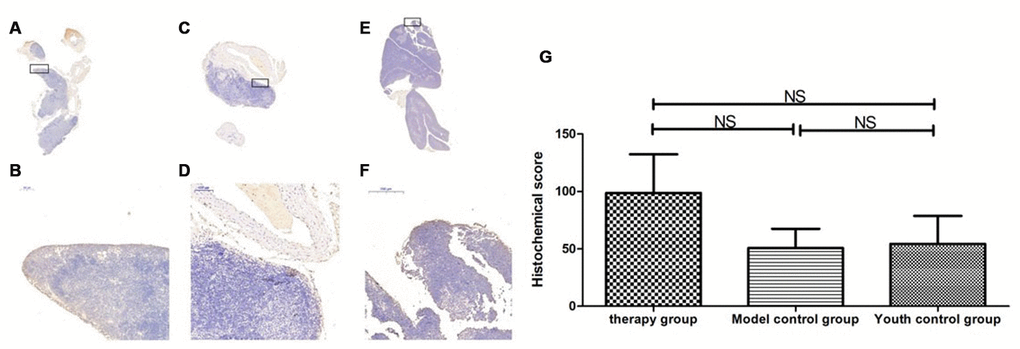
Figure 18.Expression of Sirt3 in the mouse thymus after treatment with mUCMSCs. Note: (A, B) show Sirt3 immunohistochemical staining of the thymus tissue in the treatment group after 1 month of treatment. The levels of Sirt3 were increased to different degrees in the treatment group. (C, D) show Sirt3 immunohistochemical staining of the mouse thymus tissue in the model control group; (E, F) show immunohistochemical staining of thymus Sirt1 in young control mice. (G) shows the difference in Sirt3 expression in mouse thymus tissue between different groups after mUCMSC treatment. All dark brown tissue sections were strongly positive, brownish-yellow staining was moderately positive, light yellow staining was weakly positive, and blue nuclei were negative. *** indicates p < 0.001, ** indicates p < 0.01, * indicates p < 0.05, and NS indicates p > 0.05.