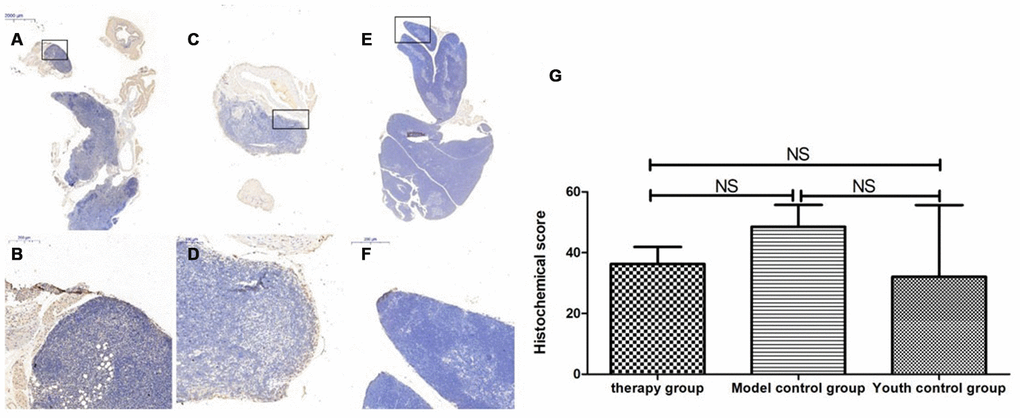
Figure 14.Differences in P53 expression in mouse thymus tissue between different groups after mUCMSC treatment. Note: (A, B) show immunohistochemical staining of p53 in the thymus tissue in the treatment group after treatment for 1 month. The expression of p53 protein in the thymus of the treatment group was increased. (C, D) show P53 immunohistochemical staining of mouse thymus tissue in the model control group. (E, F) show immunohistochemical staining of thymus P53 in young control mice. (G) shows the statistical analysis of histochemical scores. All dark brown tissue sections were strongly positive, brownish-yellow staining was moderately positive, light yellow staining was weakly positive, and blue nuclei were negative. *** indicates p < 0.001, ** indicates p < 0.01, * indicates p < 0.05, and NS indicates p > 0.05.