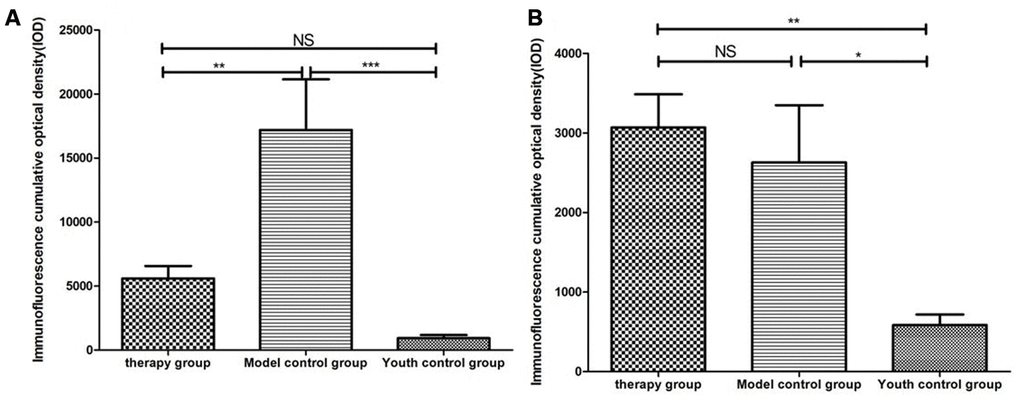
Figure 11.Differential expression of CK5 and CK8 in the thymus in different groups. (A) Thymus cytokeratin 5 expression after mUCMSC treatment; (B) Thymus cytokeratin 8 expression after mUCMSC treatment. The expression of CK5 in the thymus tissue of the treatment group was higher than that in the model control group.