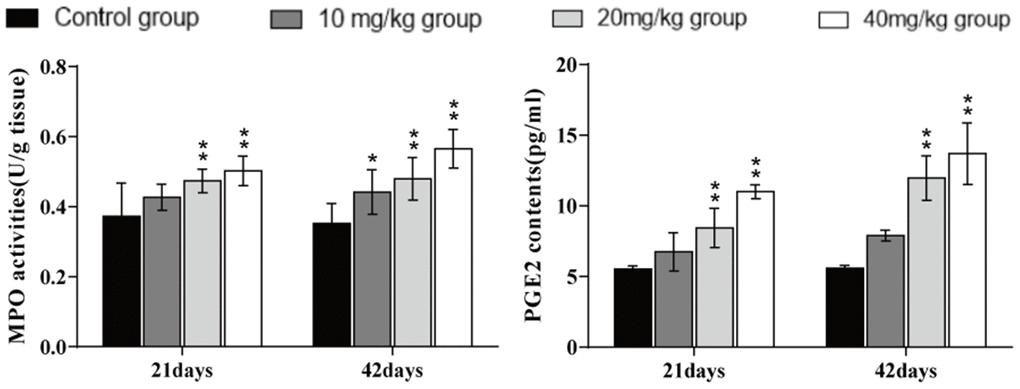
Figure 7.Changes in MPO activities and PGE2 contents in the lung at 21 and 42 days of the experiment. Data are presented with the mean± standard deviation (n=8). *p < 0.05, compared with the control group; **p < 0.01, compared with the control group.