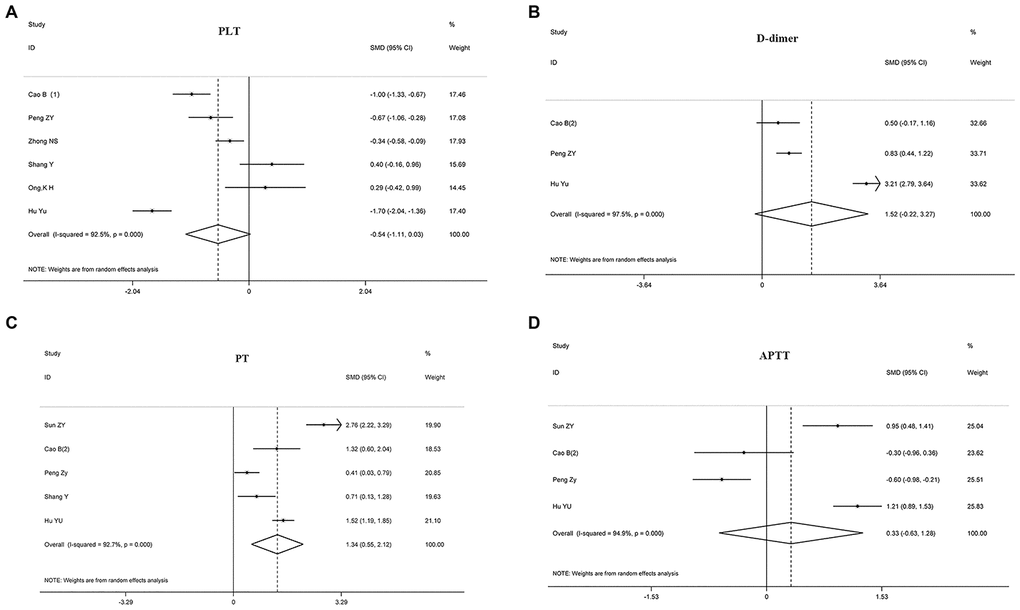
Figure 3.Forest plots assessing the composite endpoint of COVID-19 patients, as determined using coagulation parameters. The sizes of the blocks or diamonds represent the weights, and the lengths of the straight lines represent the widths of the 95% CIs. (A) Comparing patients by platelet counts; (B) comparing patients by D-dimer levels; (C) comparing patients by PT; (D) comparing patients by APTT. prothrombin time (PT); activated partial thromboplastin time (APTT).