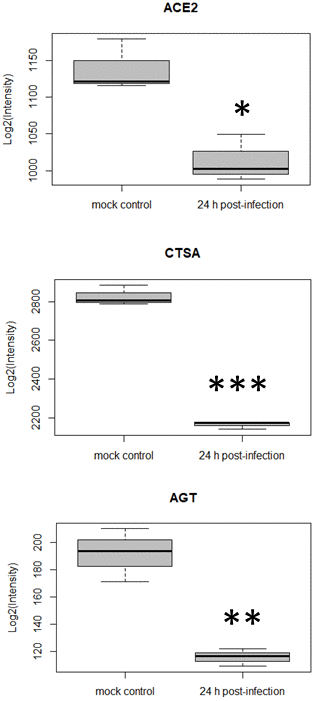
Figure 3.Differential expression for three host cell proteins in the renin-angiotensin system at 24 h post SARS-CoV-2 infection (*p-value <0.05, **p-value <0.01, ***p-value <0.0001, comparison to mock control).
Figure 3 — Re-analysis of SARS-CoV-2-infected host cell proteomics time-course data by impact pathway analysis and network analysis: a potential link with inflammatory response | Aging