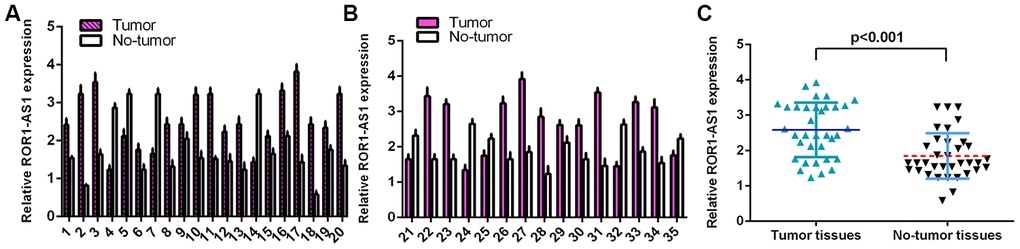
Figure 1.ROR1-AS1 level in osteosarcoma tissues. (A) The detail expression of ROR1-AS1 of case 1-20 was shown. (B) The detail expression of ROR1-AS1 of case 21-35 was shown. (C) ROR1-AS1 was higher in osteosarcoma tissues compared to no-tumor samples.