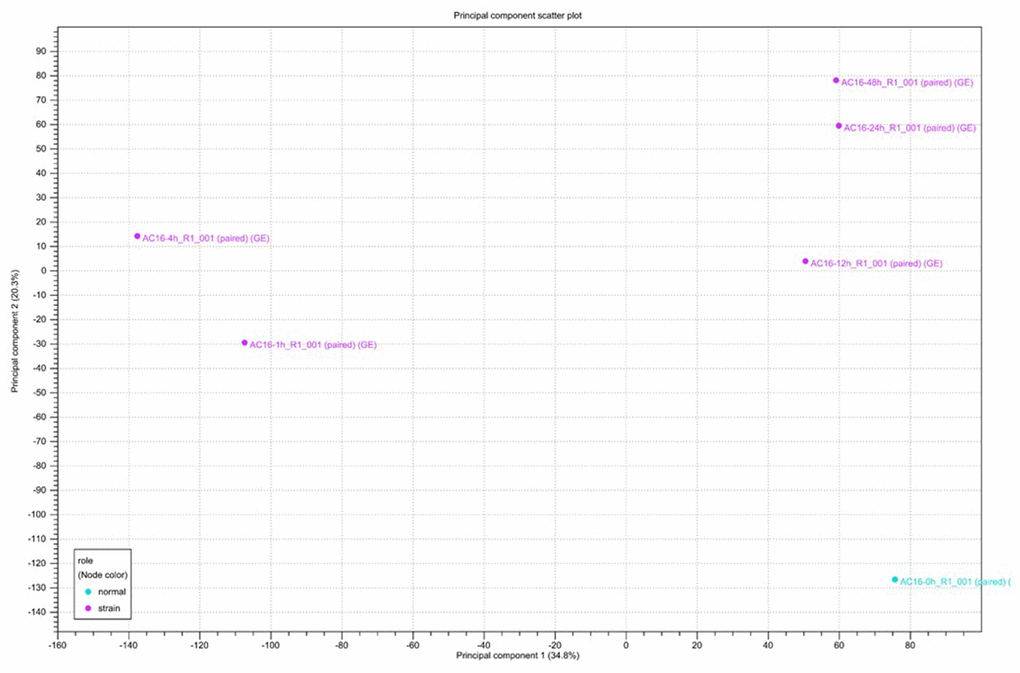
Figure 2.Principal component analysis (PCA) of RNA-seq data. Gene expression changes were investigated after 0, 1, 4, 12, 24, and 48 hours of cyclic stretching. PCA was performed using normalized RNA-Seq data for genes differentially expressed in one pairwise comparison: 0 h vs. other time points.