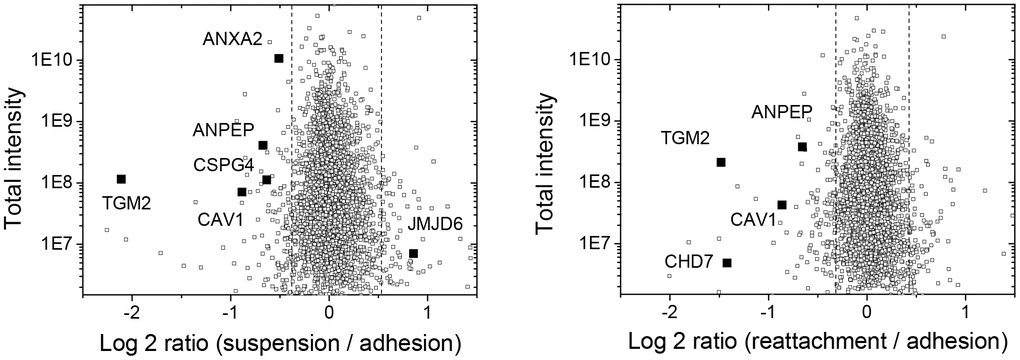
Figure 2.Plots of log2-ratio and intensity to show the distribution of upregulated and downregulated protein identities in suspended melanoma and re-attached melanoma cells as analyzed by quantitative proteomic analysis. The significantly changed proteins associated with vessel development were indicated by solid squares.