Submit an Article
Navigate
Home
Editorial Board
Editorial Policies
Current Volume
Archive
Scientific Integrity
Publication Ethics Statements
Interviews with Outstanding Authors
Newsroom
Sponsored Conferences
Podcast
Contact
Special Collections
Submit an Article
Online ISSN: 1945-4589
Research Paper
|
Volume 12, Issue 12
|
pp. 12222–12233
ApoE
e2 and aging-related outcomes in 379,000 UK Biobank participants
Back to article
Figure 3
(3 of 5)
−
100%
+
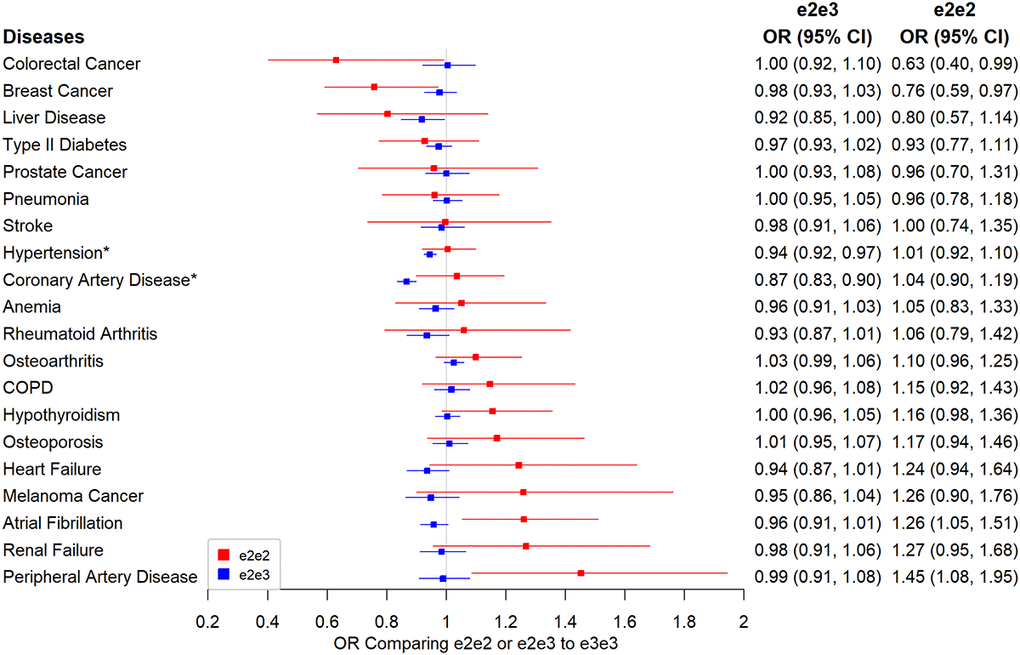
Figure 3.
Associations between e2 (e2e2 or e2e3) and primary disease outcomes.
Note: Traits labelled with an asterisk if significant at the Bonferroni-corrected level of 5% (*p<0.05/106).